Master Sapioverse
This guide details every interface and tool in the platform so you can turn your databases into a real competitive advantage.
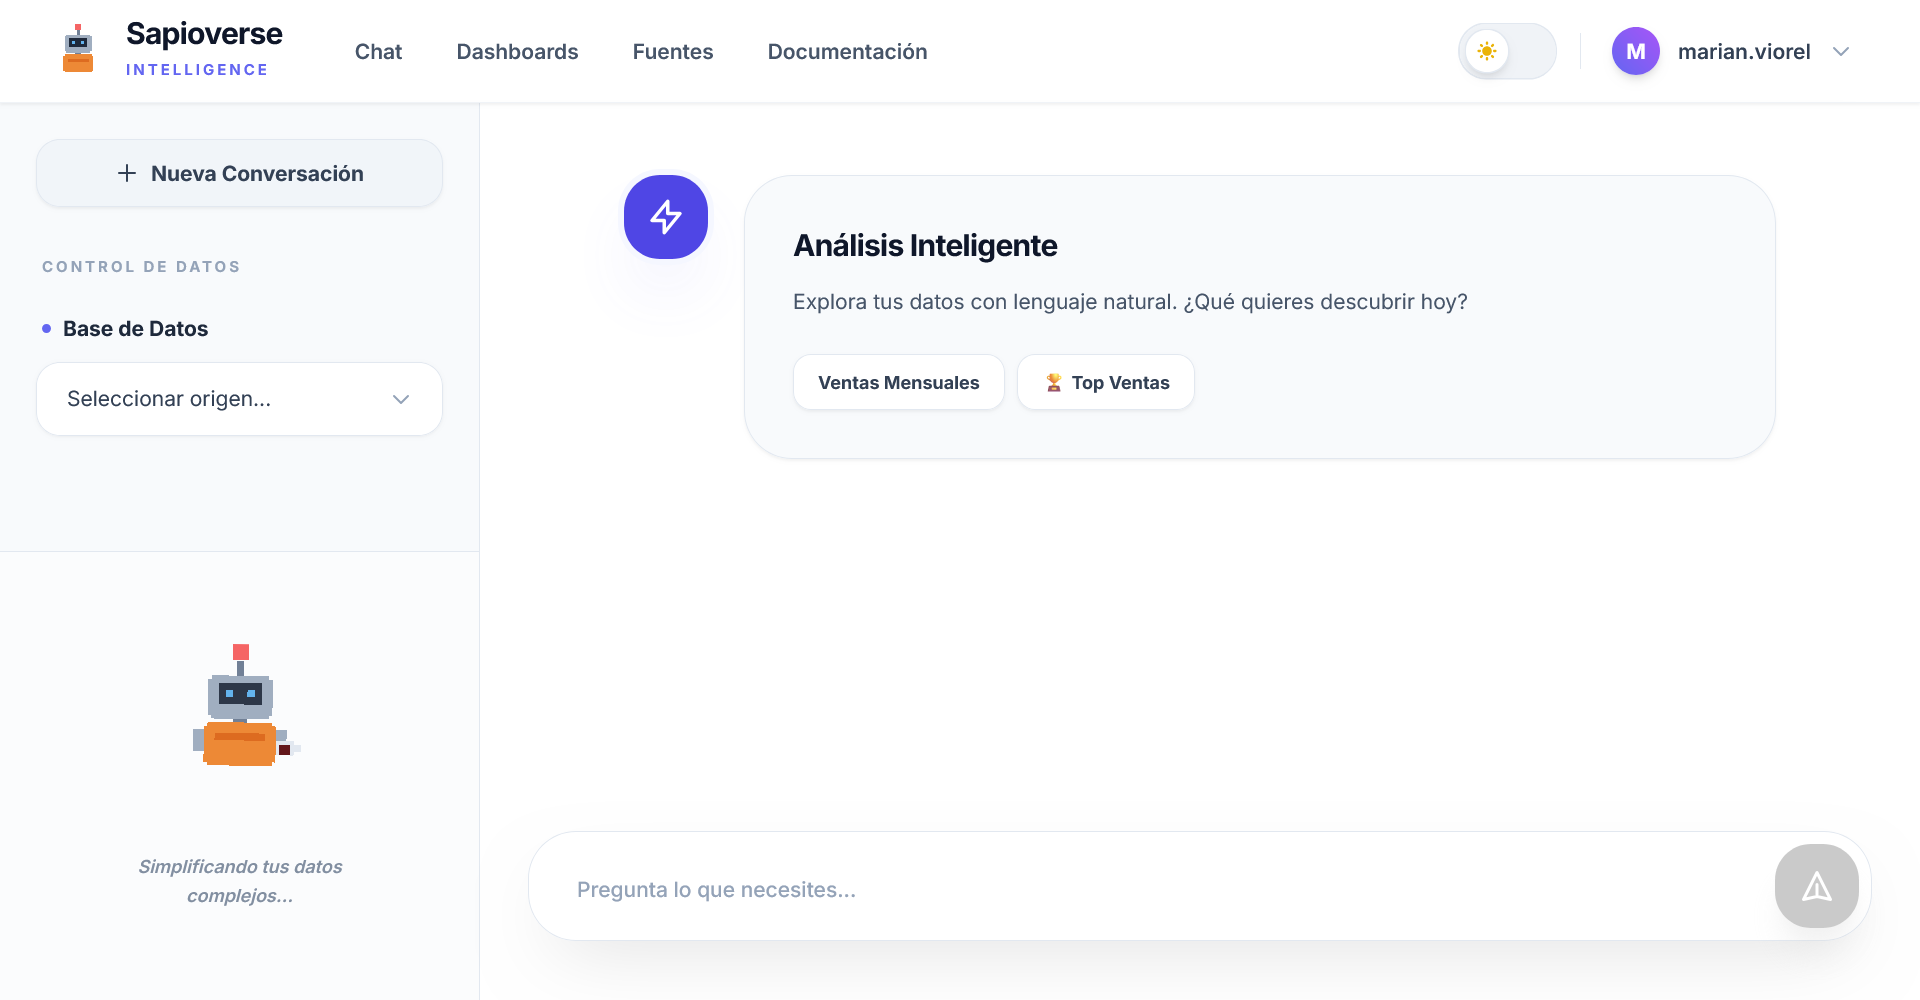
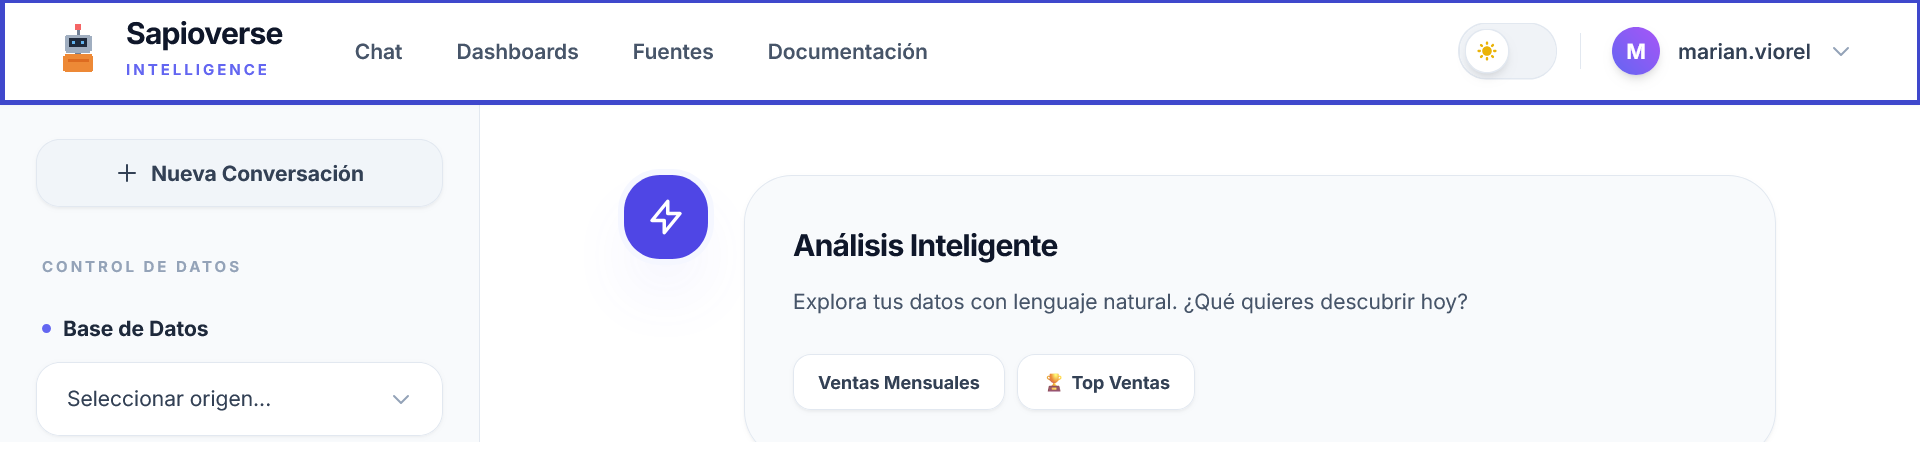
Global Navigation
The top bar is your quick access to all Sapioverse tools.
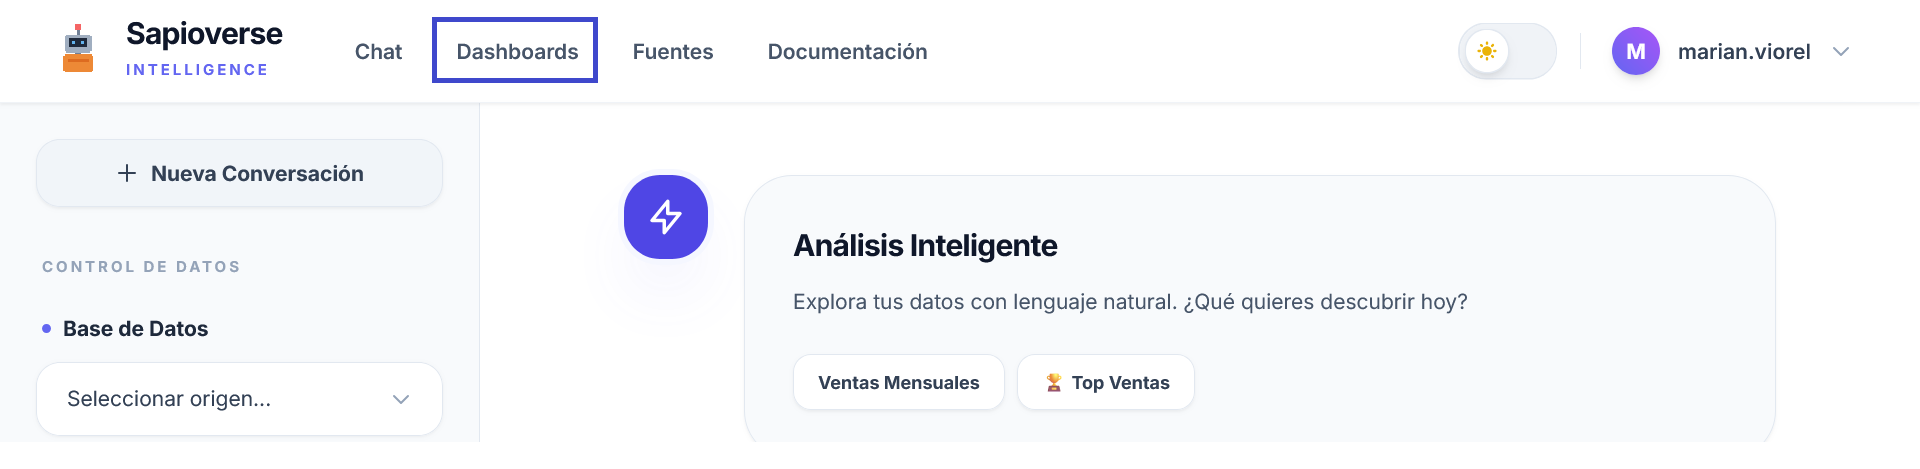
Dashboards
Access your dashboards and saved metrics.
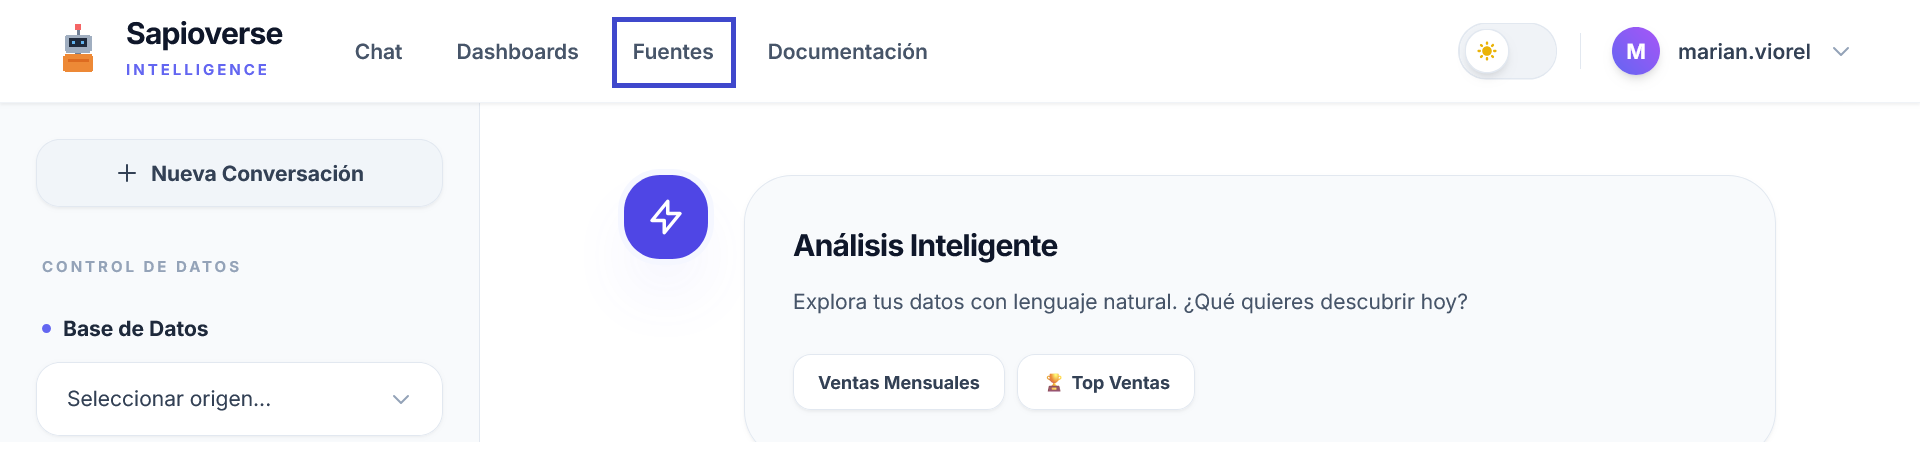
Data Sources
Set up connections and manage your data structure.
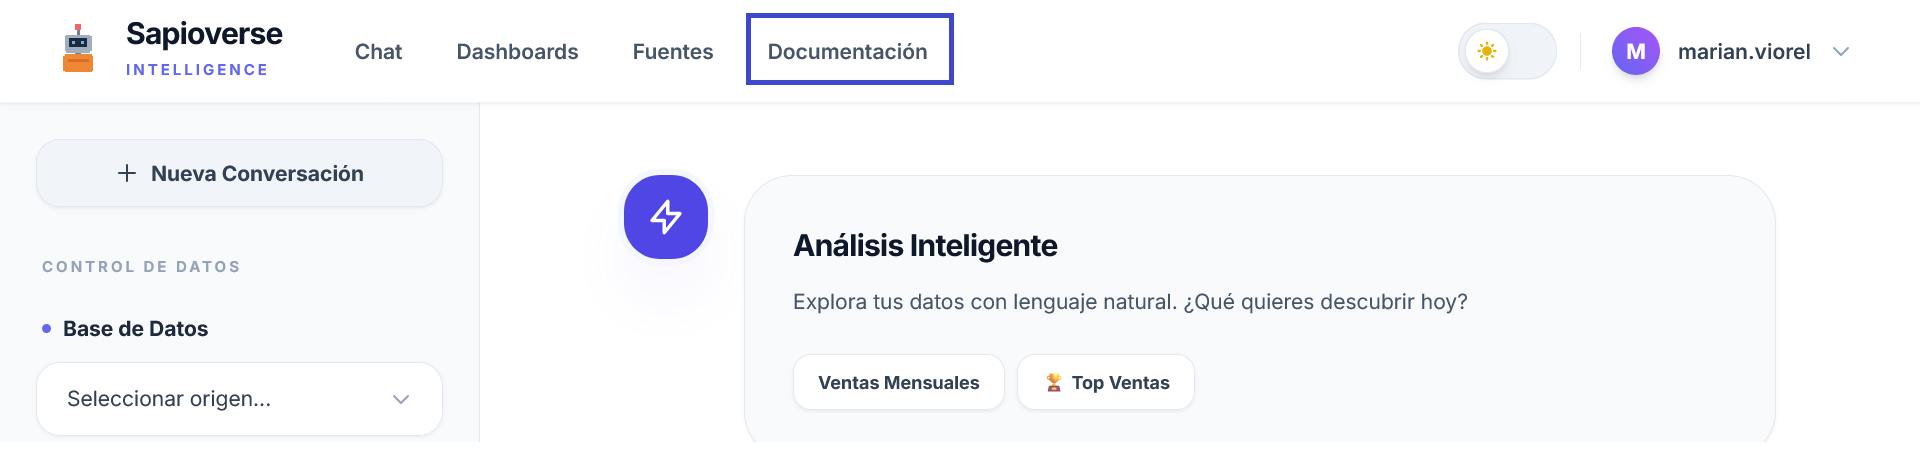
User Guide
Direct access to this guide and help resources.
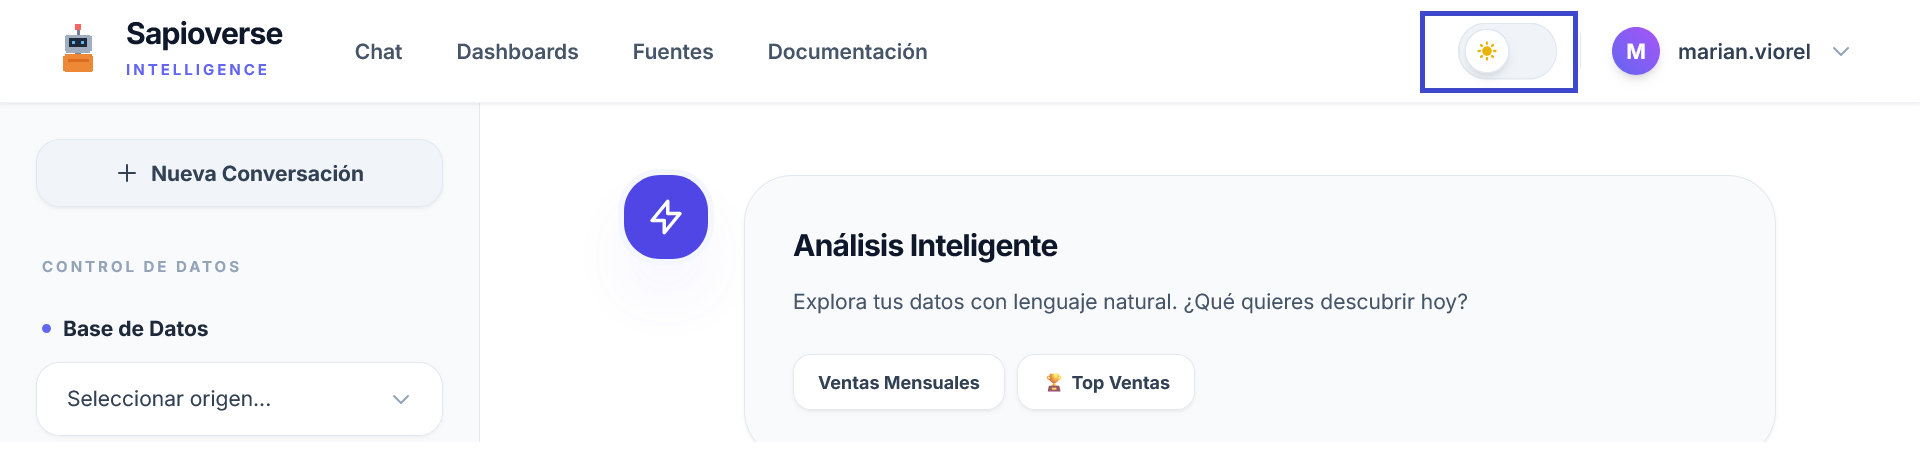
Visual Mode
Switch between light and dark themes for your comfort.
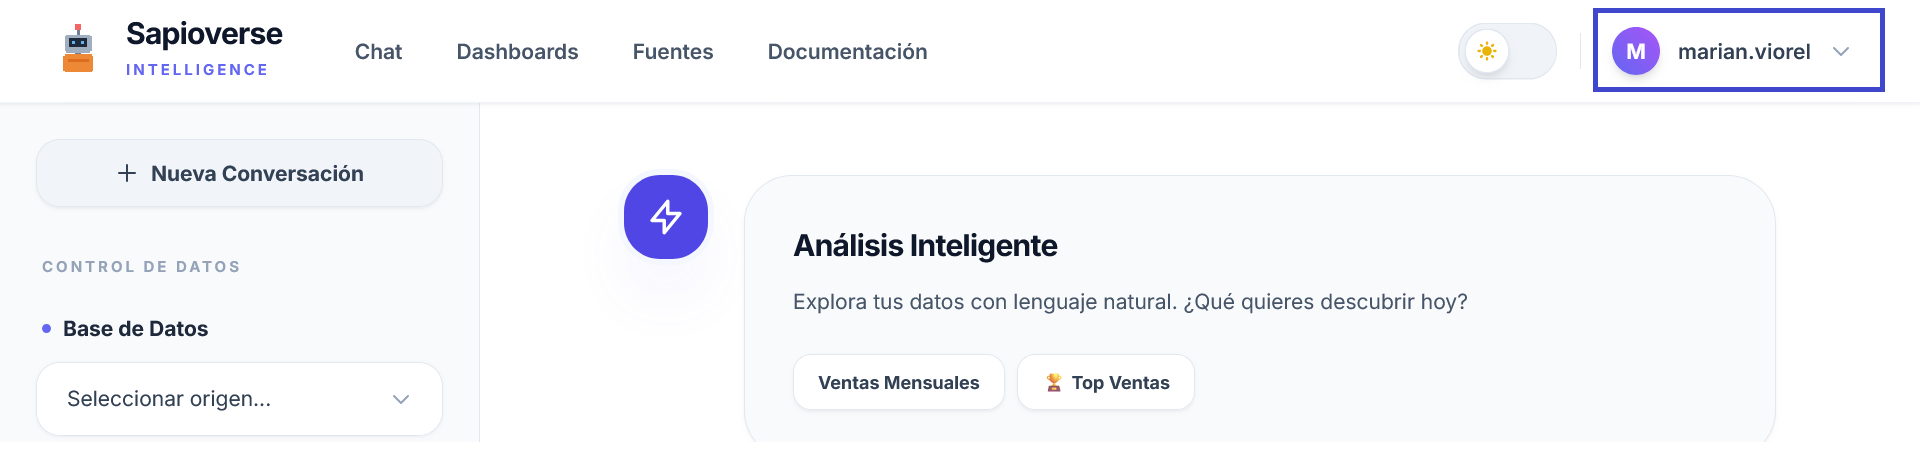
Profile and Organization
Manage your account, team, and sign out.
Analysis Chat
The Chat is your main tool to ask your data directly and get immediate answers in natural language. No technical knowledge required; just ask whatever you need to know:
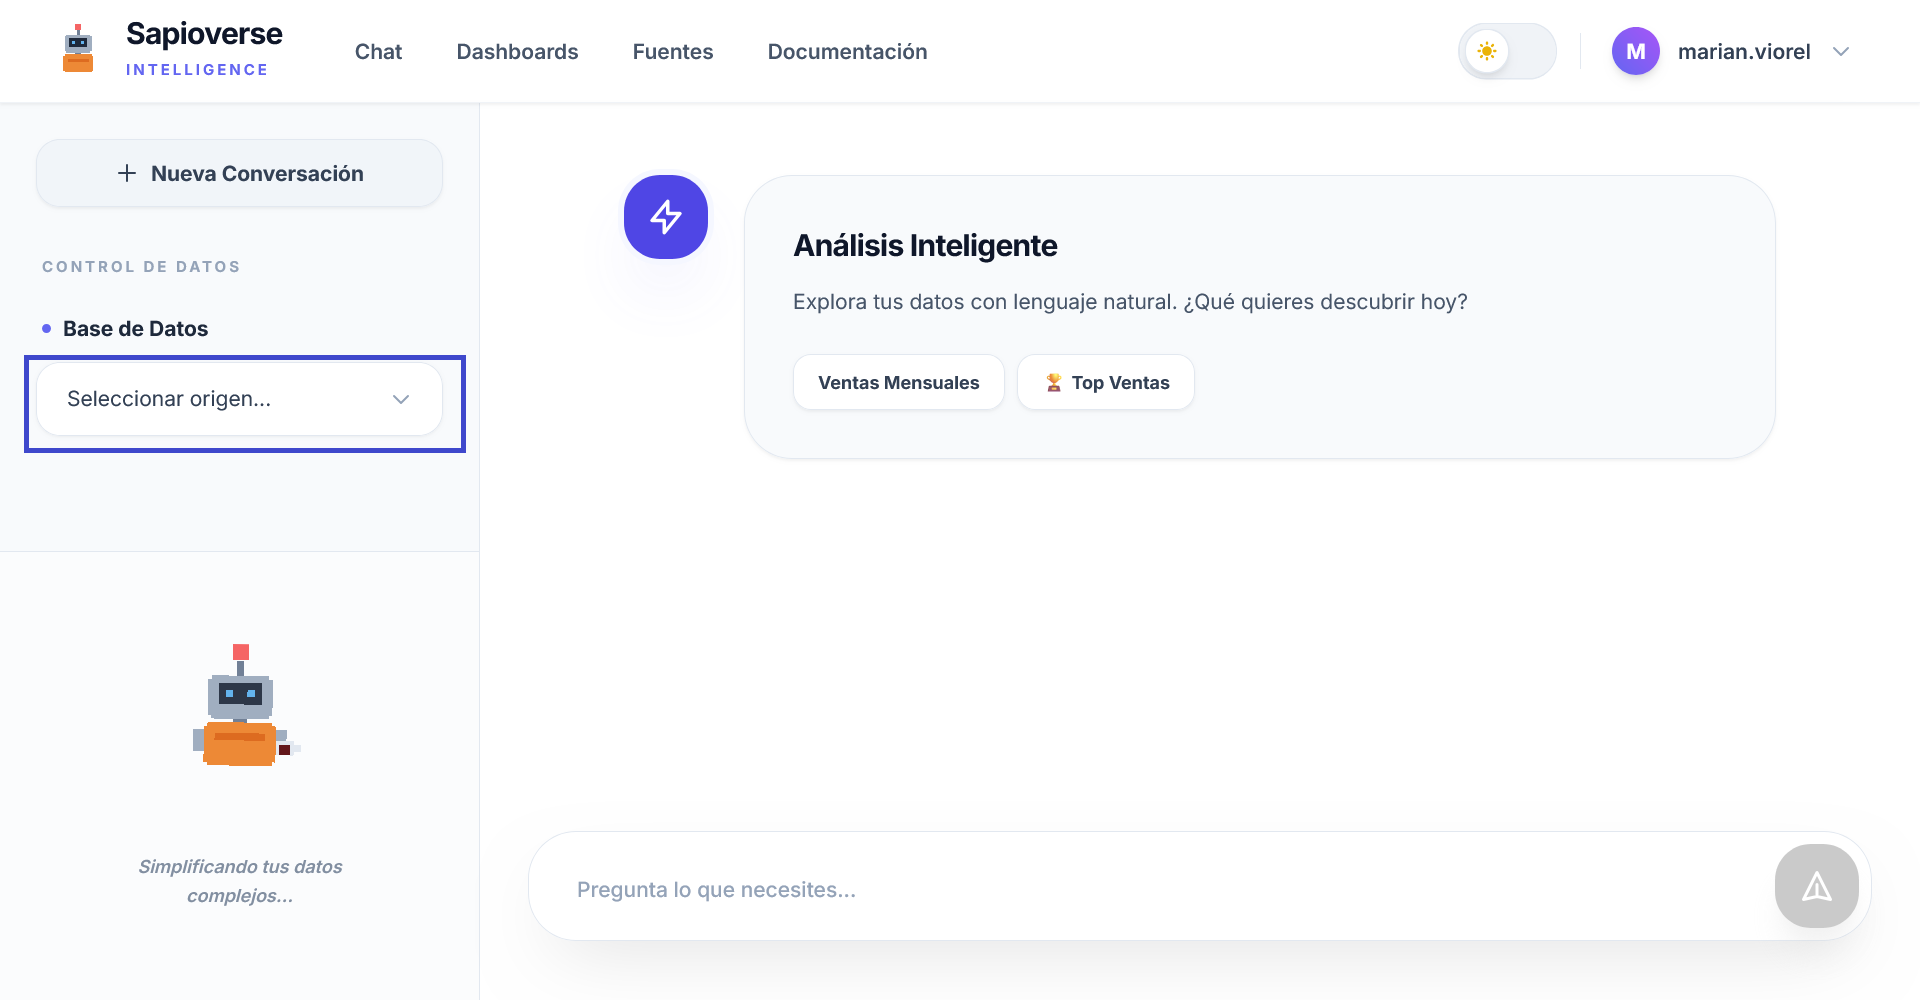
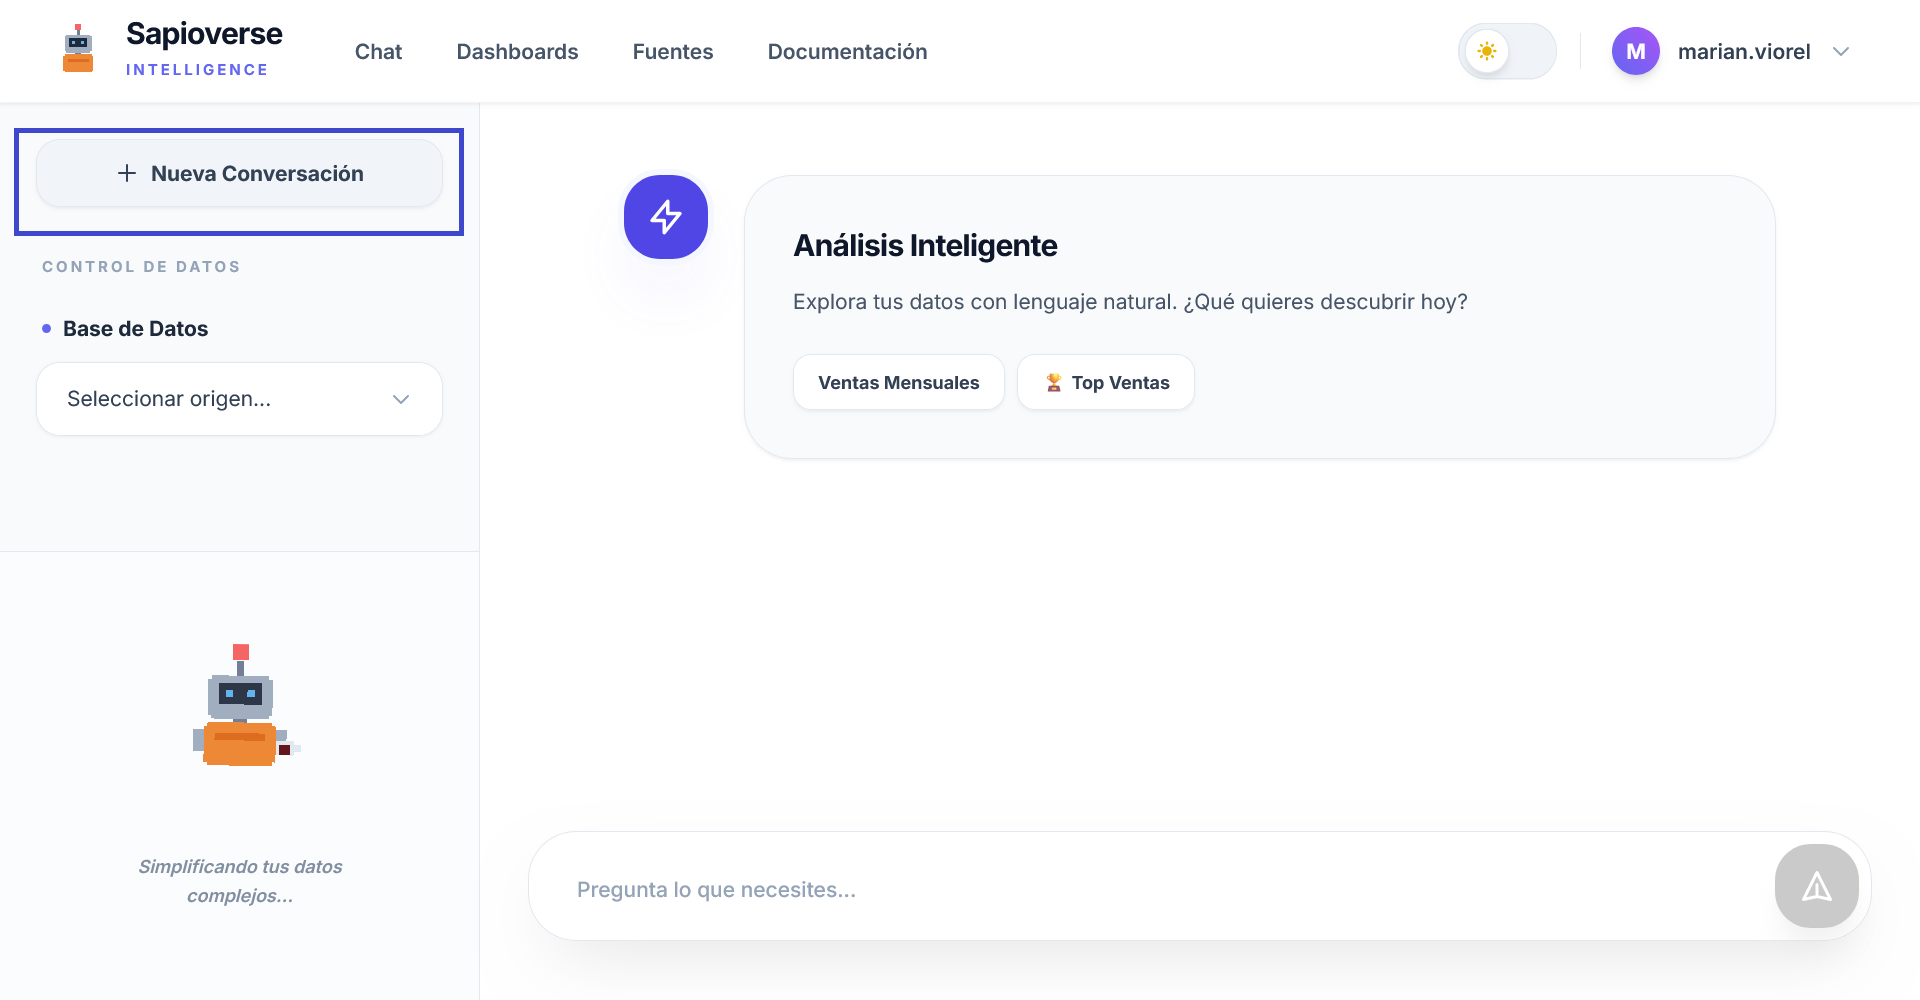
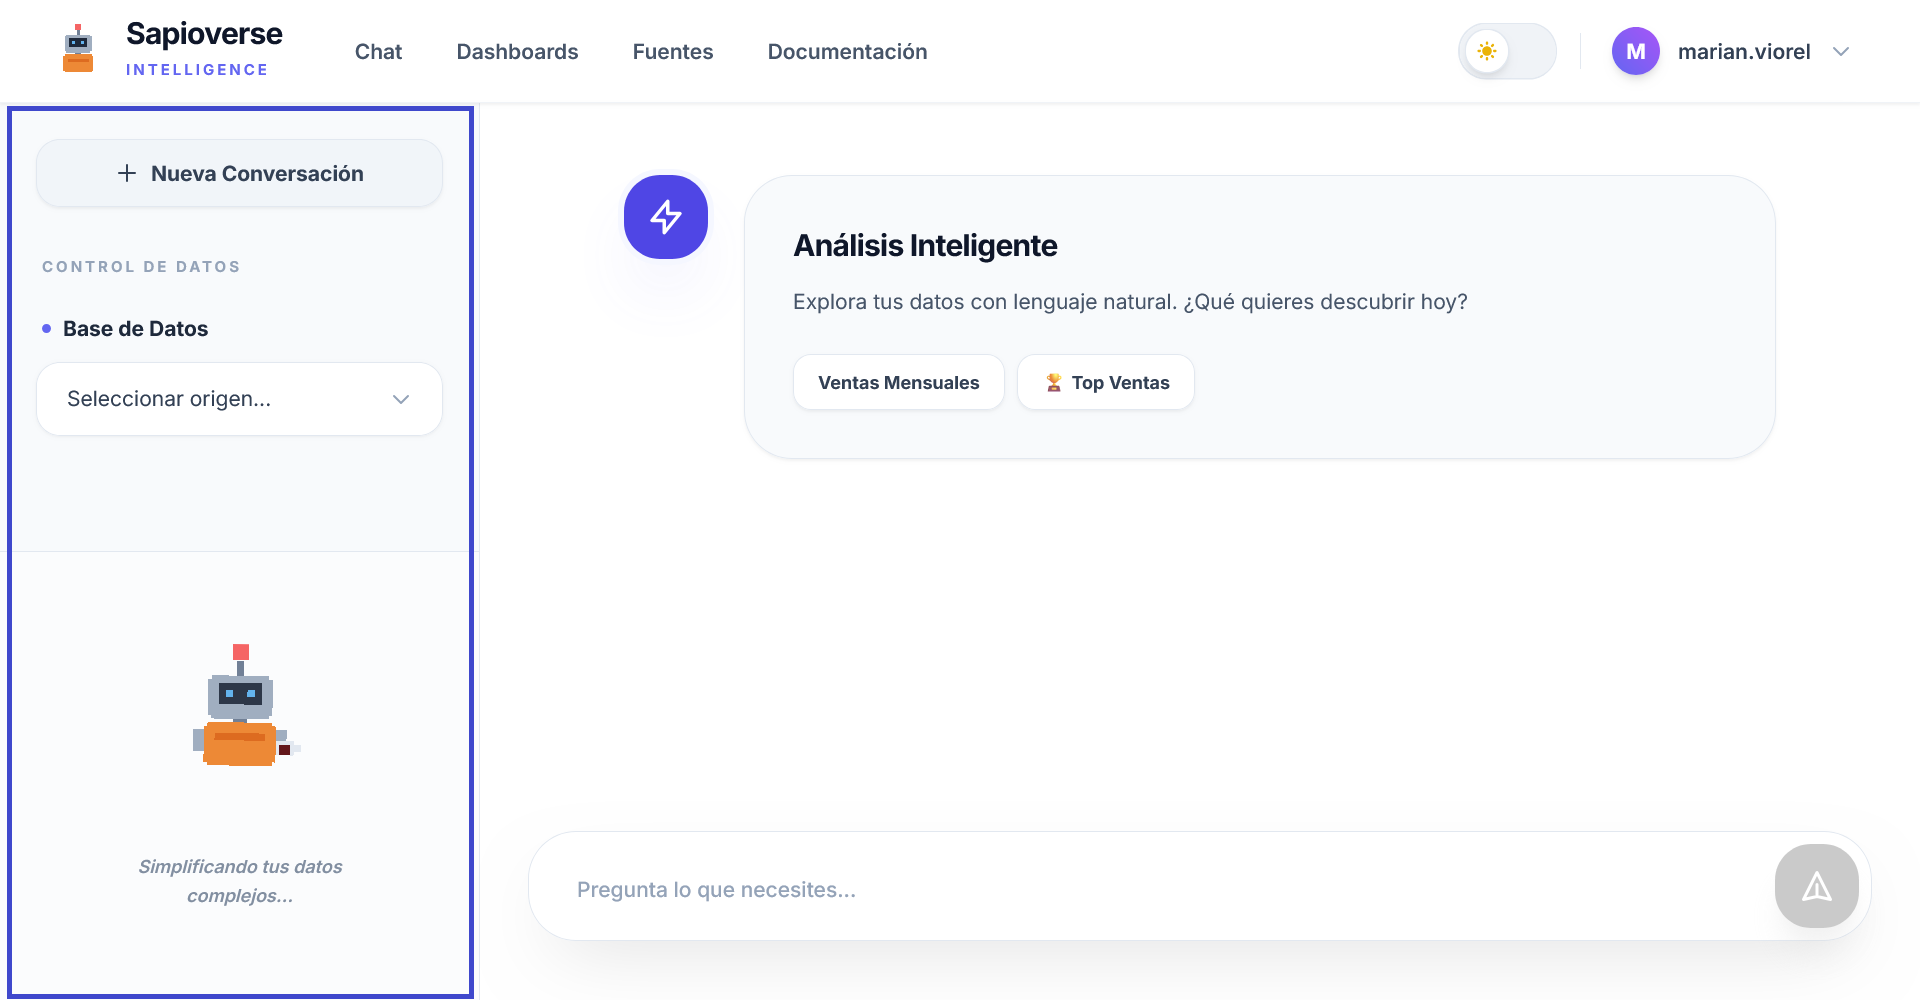
Database Selector
In the left panel, you can choose the data source you want to query. Once selected, the system will confirm it's ready. If you want to change topics or clear the screen, click "New Conversation".
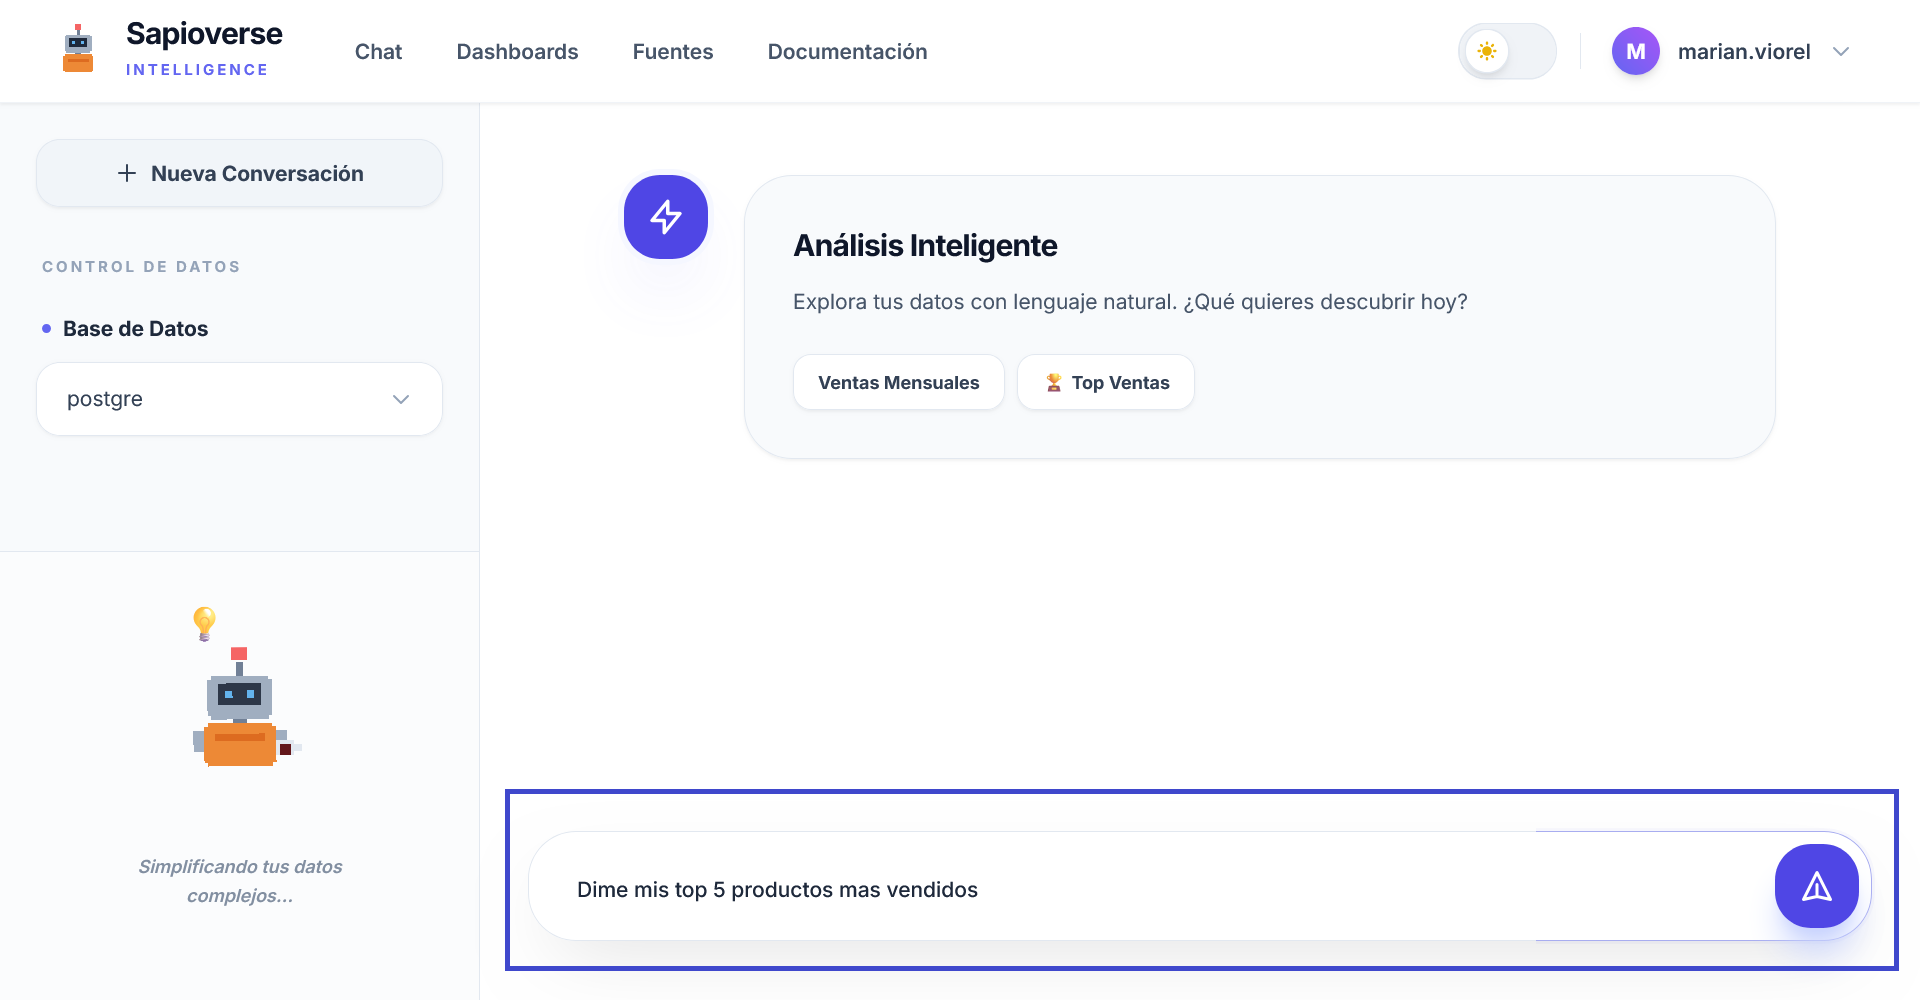
Writing Queries
The bottom area lets you type business questions. The intelligence understands the context of your previous questions to follow up on the analysis.
Analysis Results
Each answer includes an Executive Summary, an Interactive Chart, a detailed Data Table and the generated Technical Query. You can pin any analysis to a dashboard.
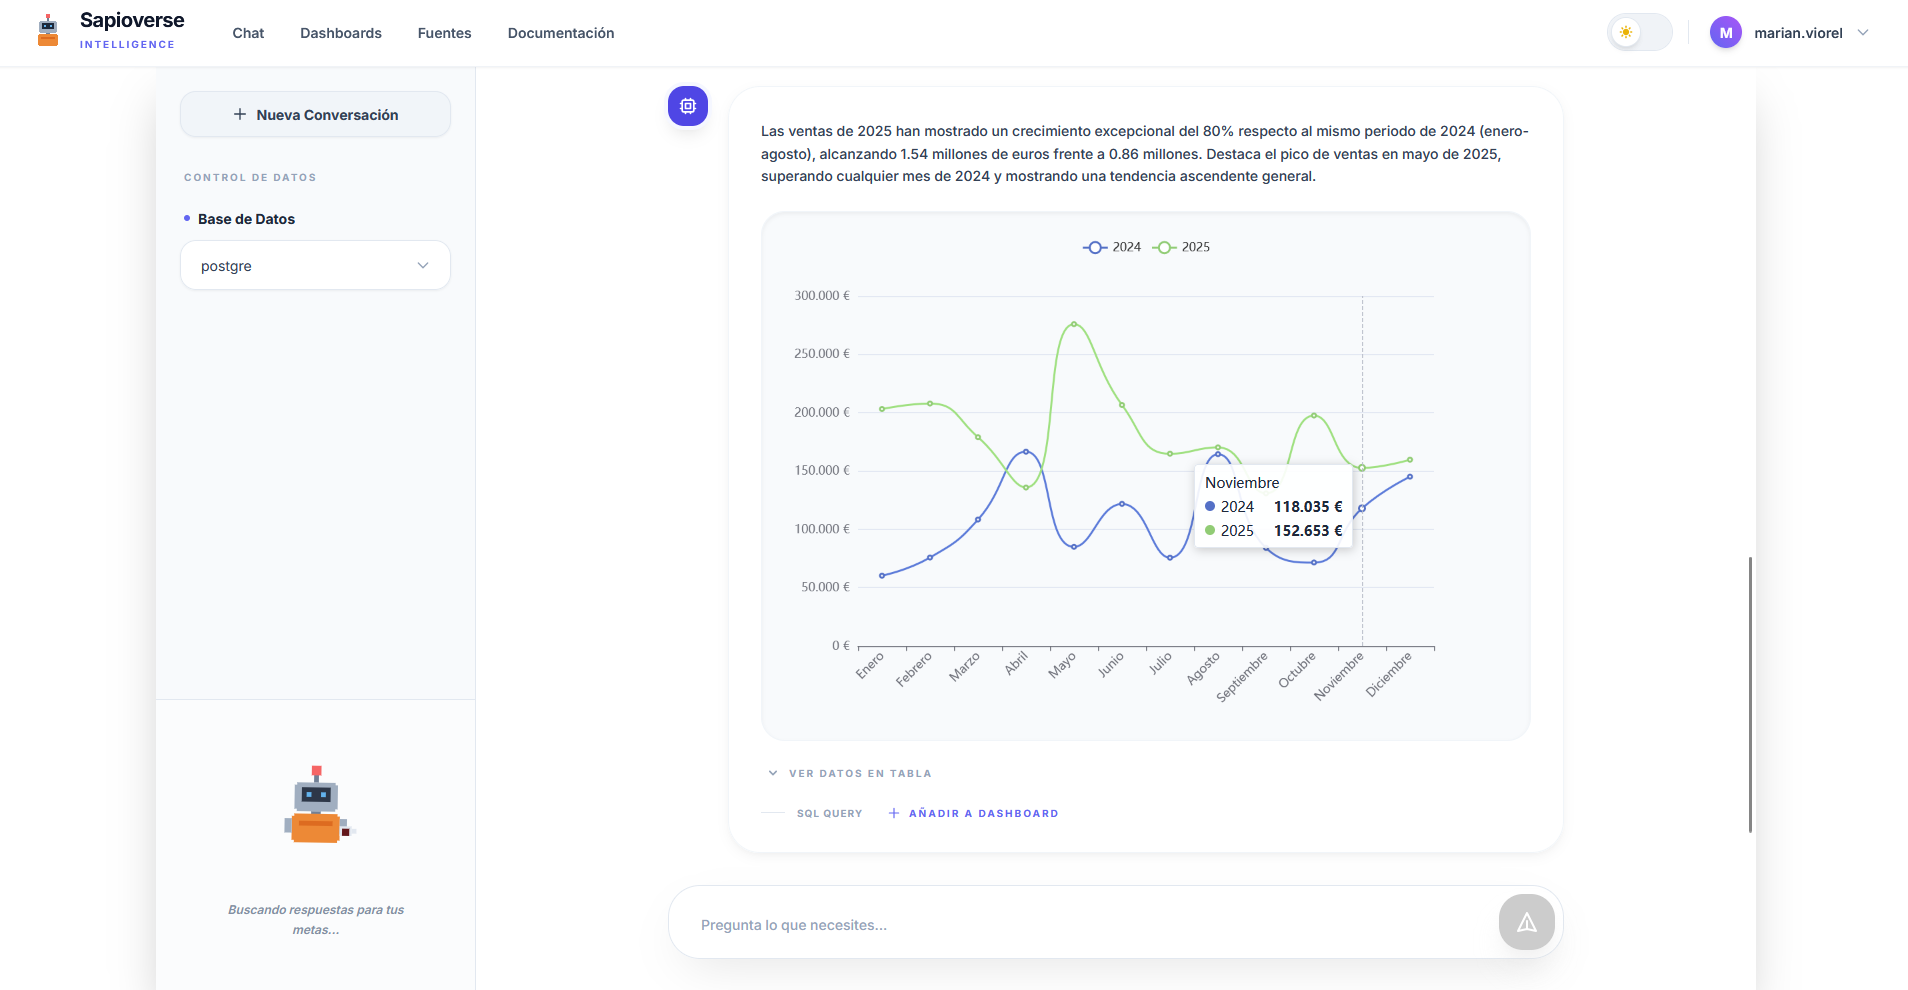
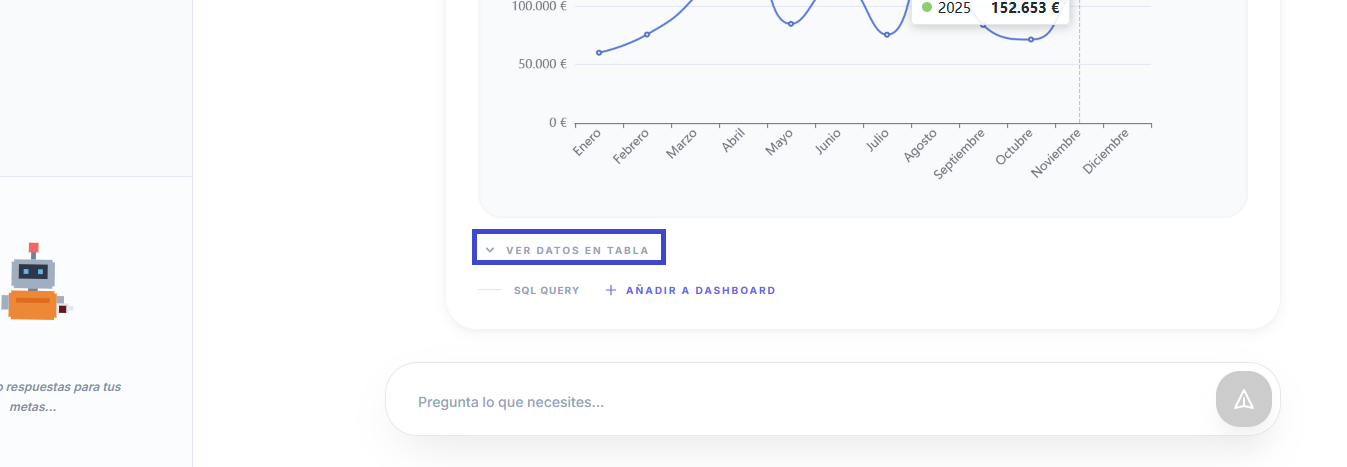
View the raw data behind the analysis.
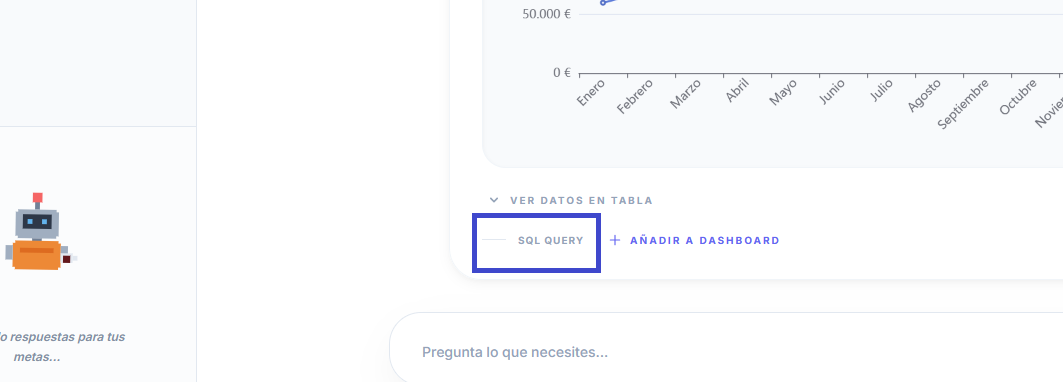
Check the system's technical logic.
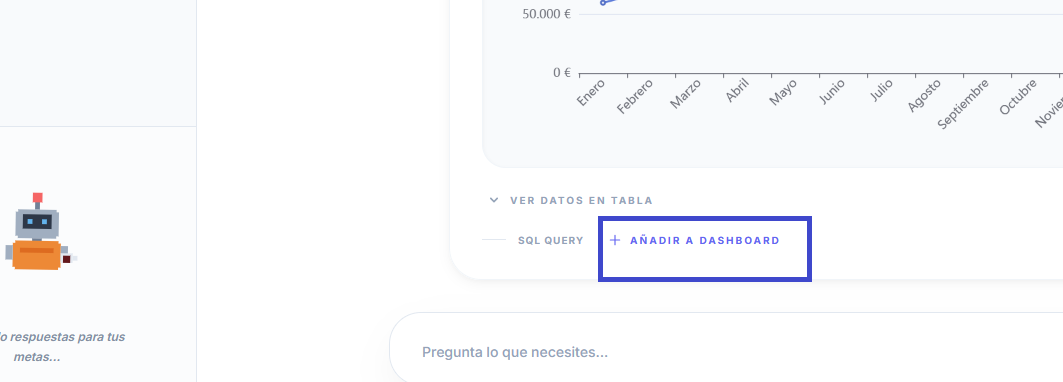
Pin the chart to a dashboard.
Bulk Export Mode
When you need to extract large volumes of data for external analysis or audits, you can activate Export Mode directly from the chat bar.
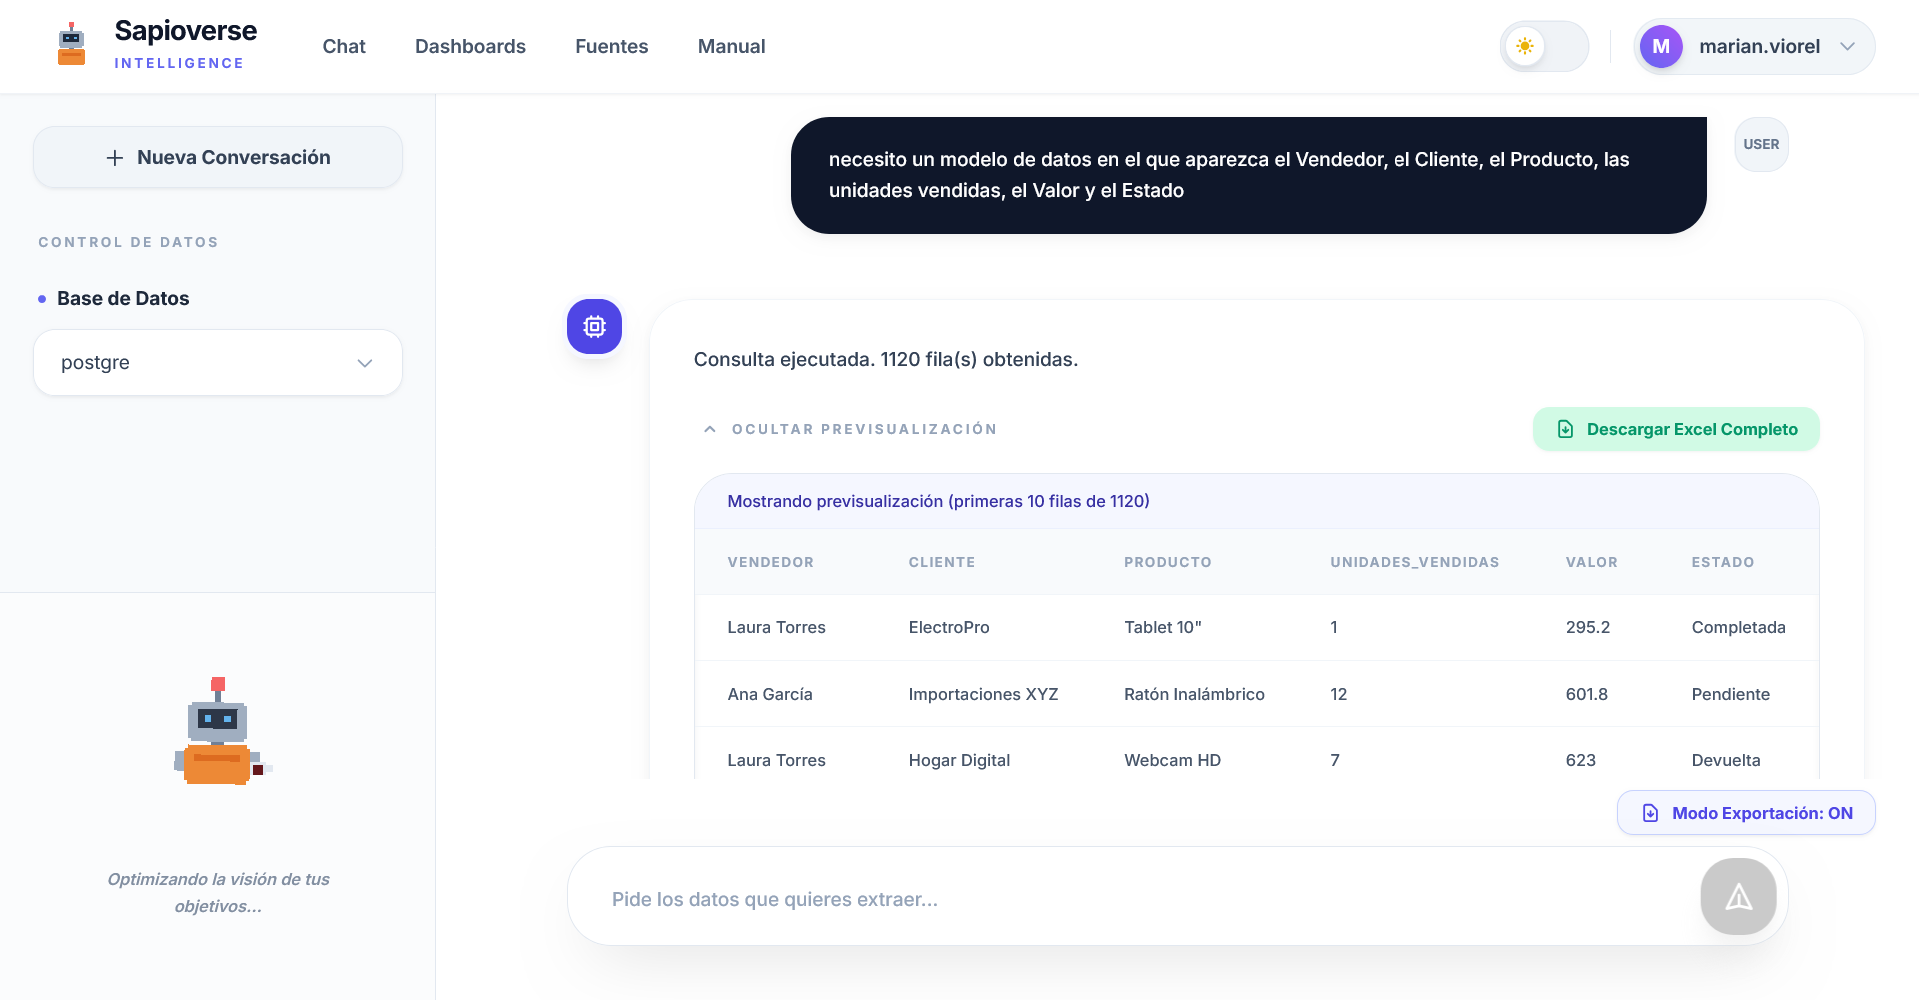
No Automatic Limits
By activating this mode, the AI ignores display restrictions (LIMIT/TOP) to extract all data that matches your description, allowing downloads of up to 20,000 records.
Professional Excel Format
Once the response is obtained, you can download the full dataset in a .xlsx file ready to be processed in spreadsheet tools.
Control Panels
Dashboards are spaces where you monitor your key indicators in real time. Group your most important metrics in a single view to make informed decisions.
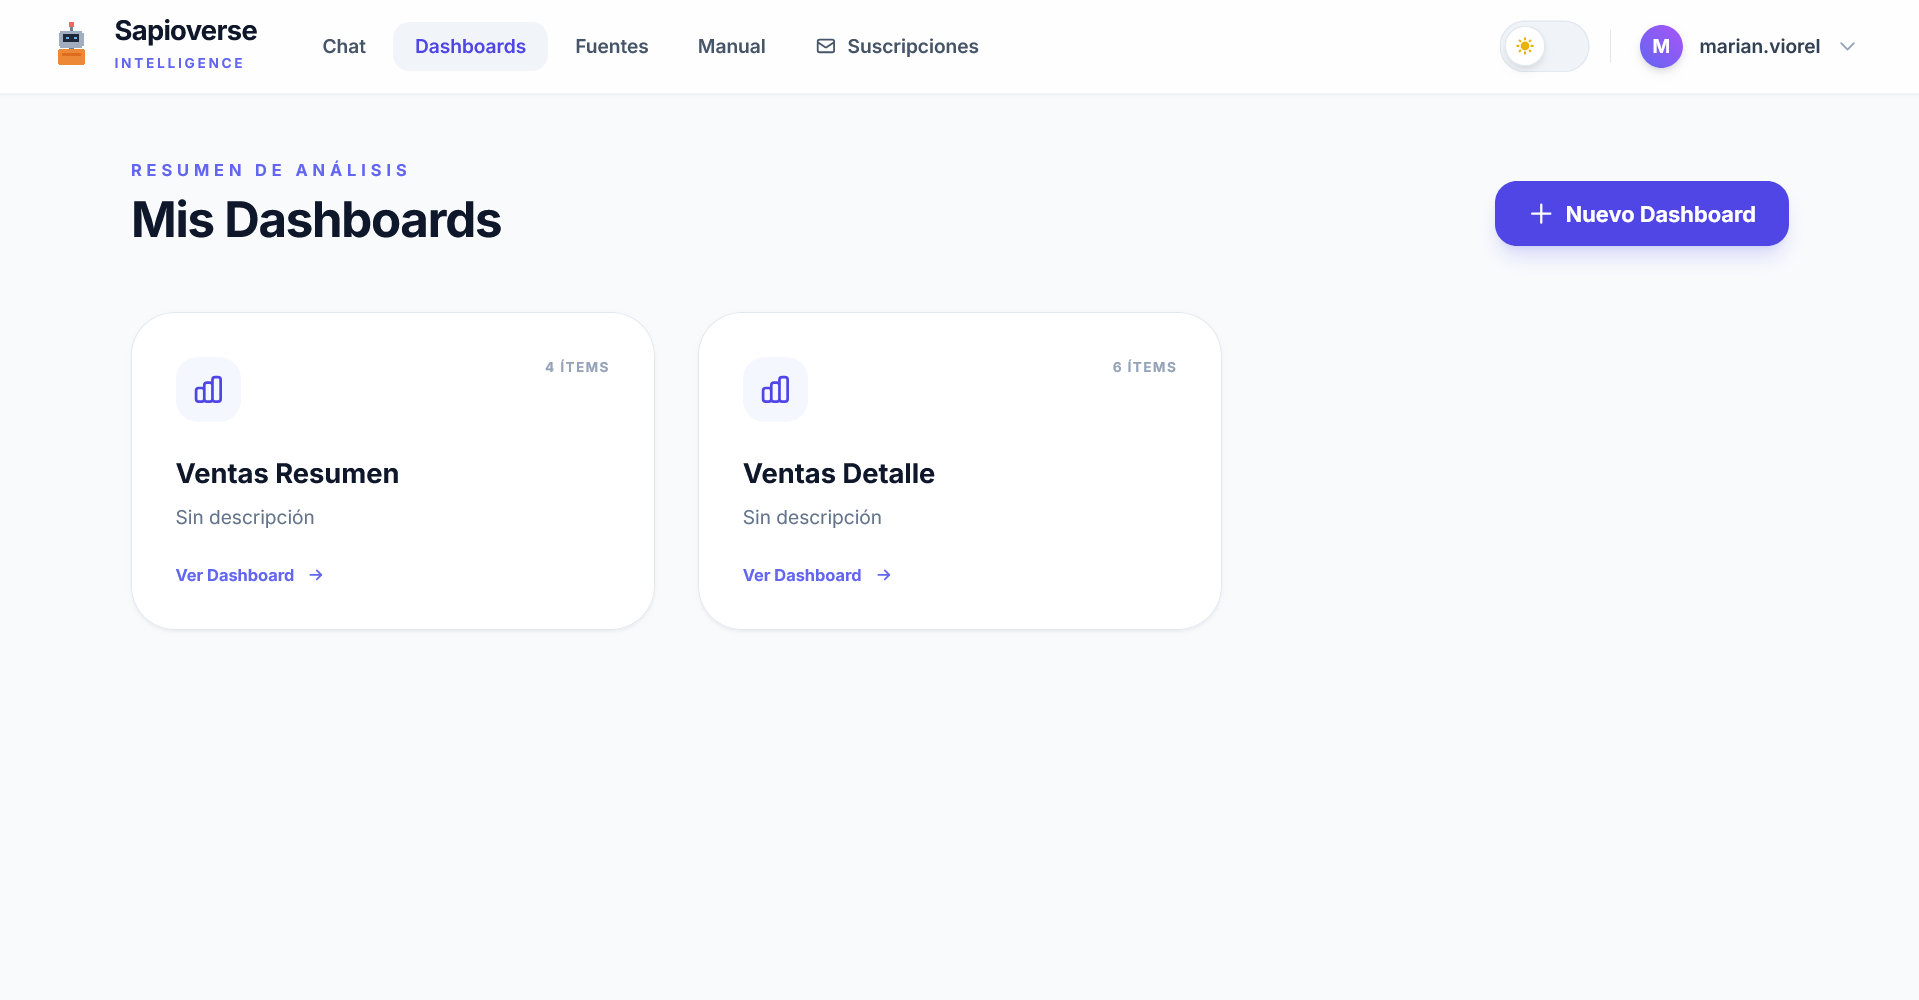
Custom Organization
Create specific panels for each area (e.g., Sales, Operations) to group your most relevant analyses and share them with your team.
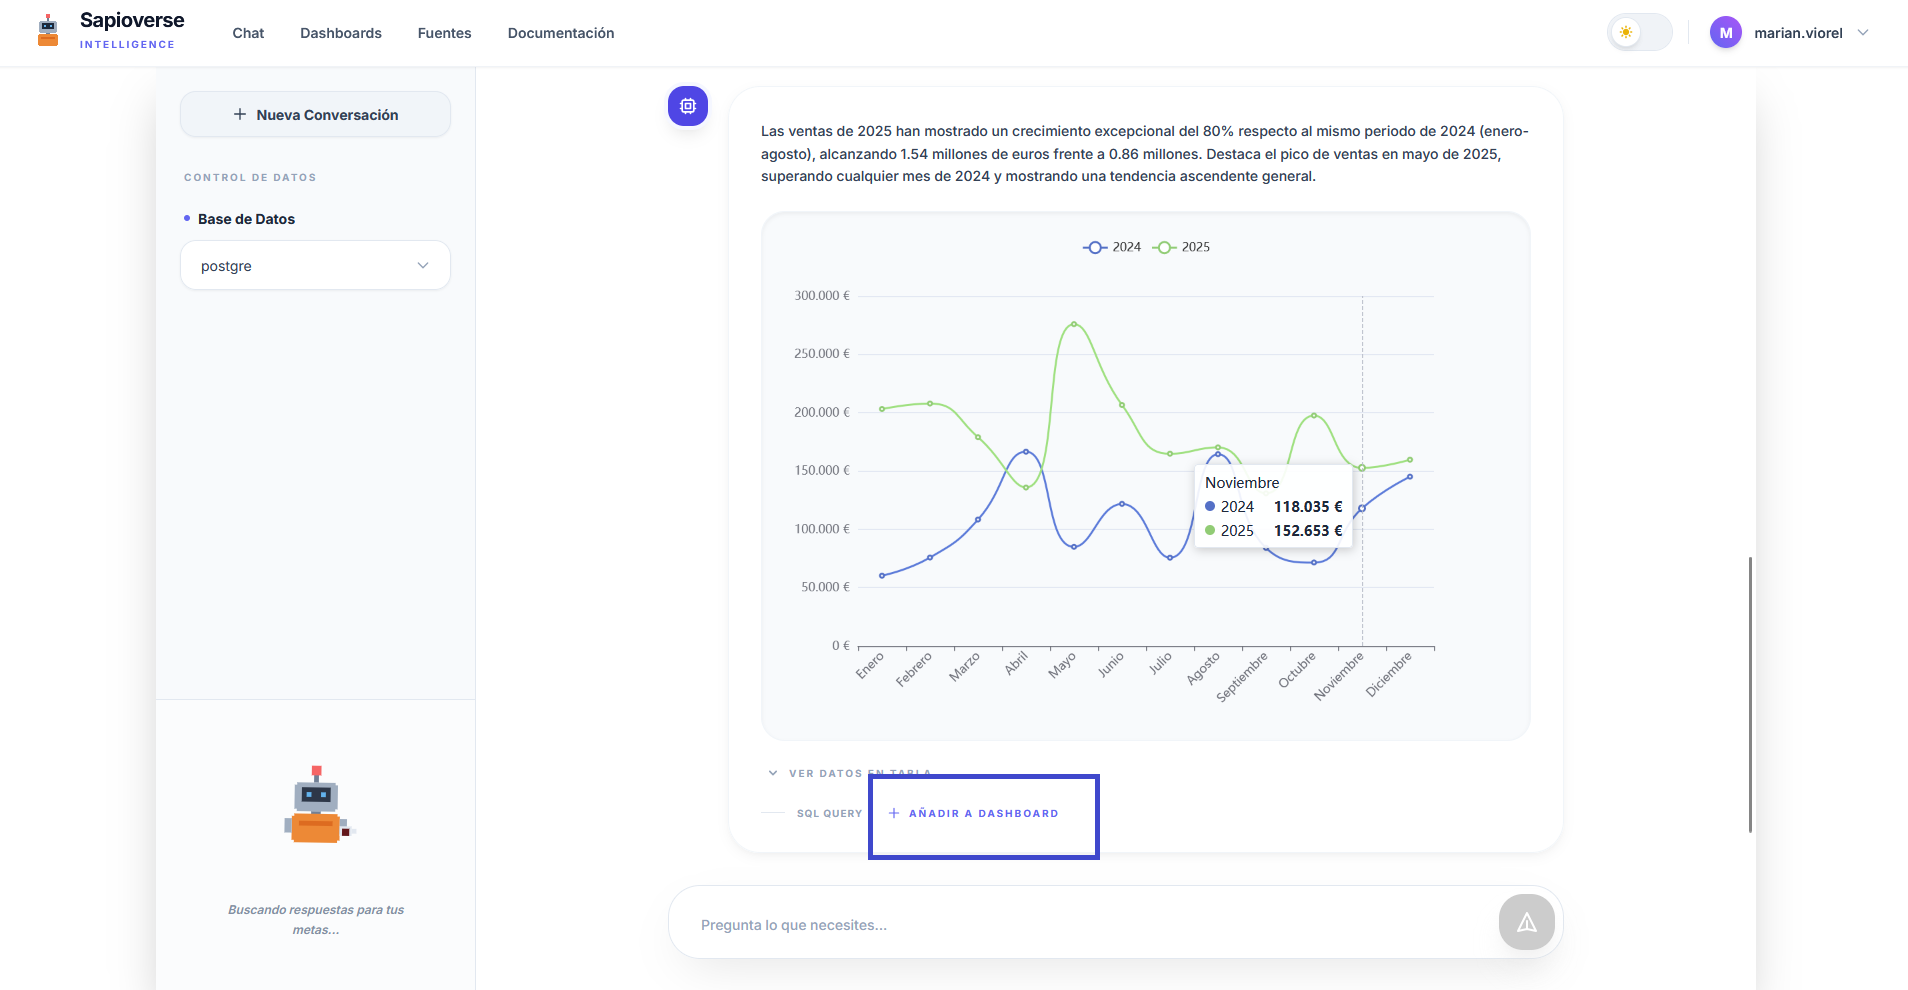
Use the "ADD TO DASHBOARD" button in any Chat response to send it to a dashboard.
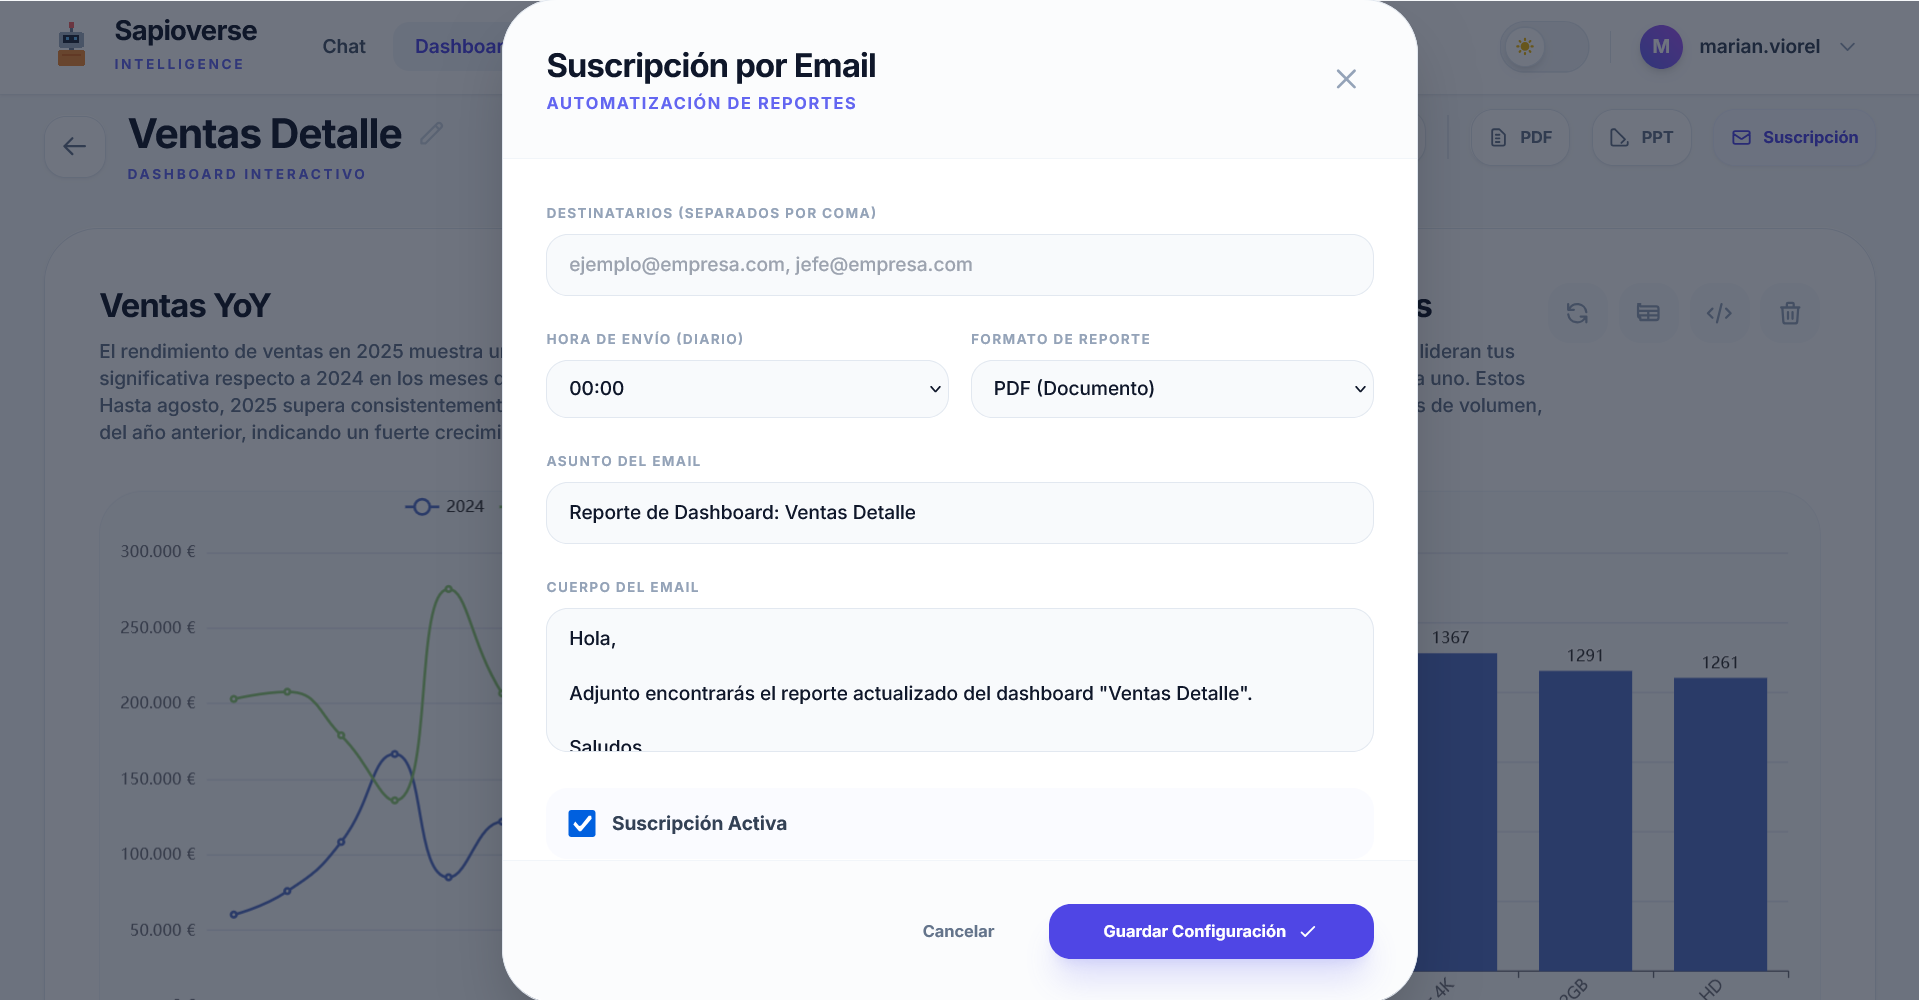
Automatic Reports
Receive your panels directly in your email with the frequency you choose (Daily, Weekly, or Monthly).
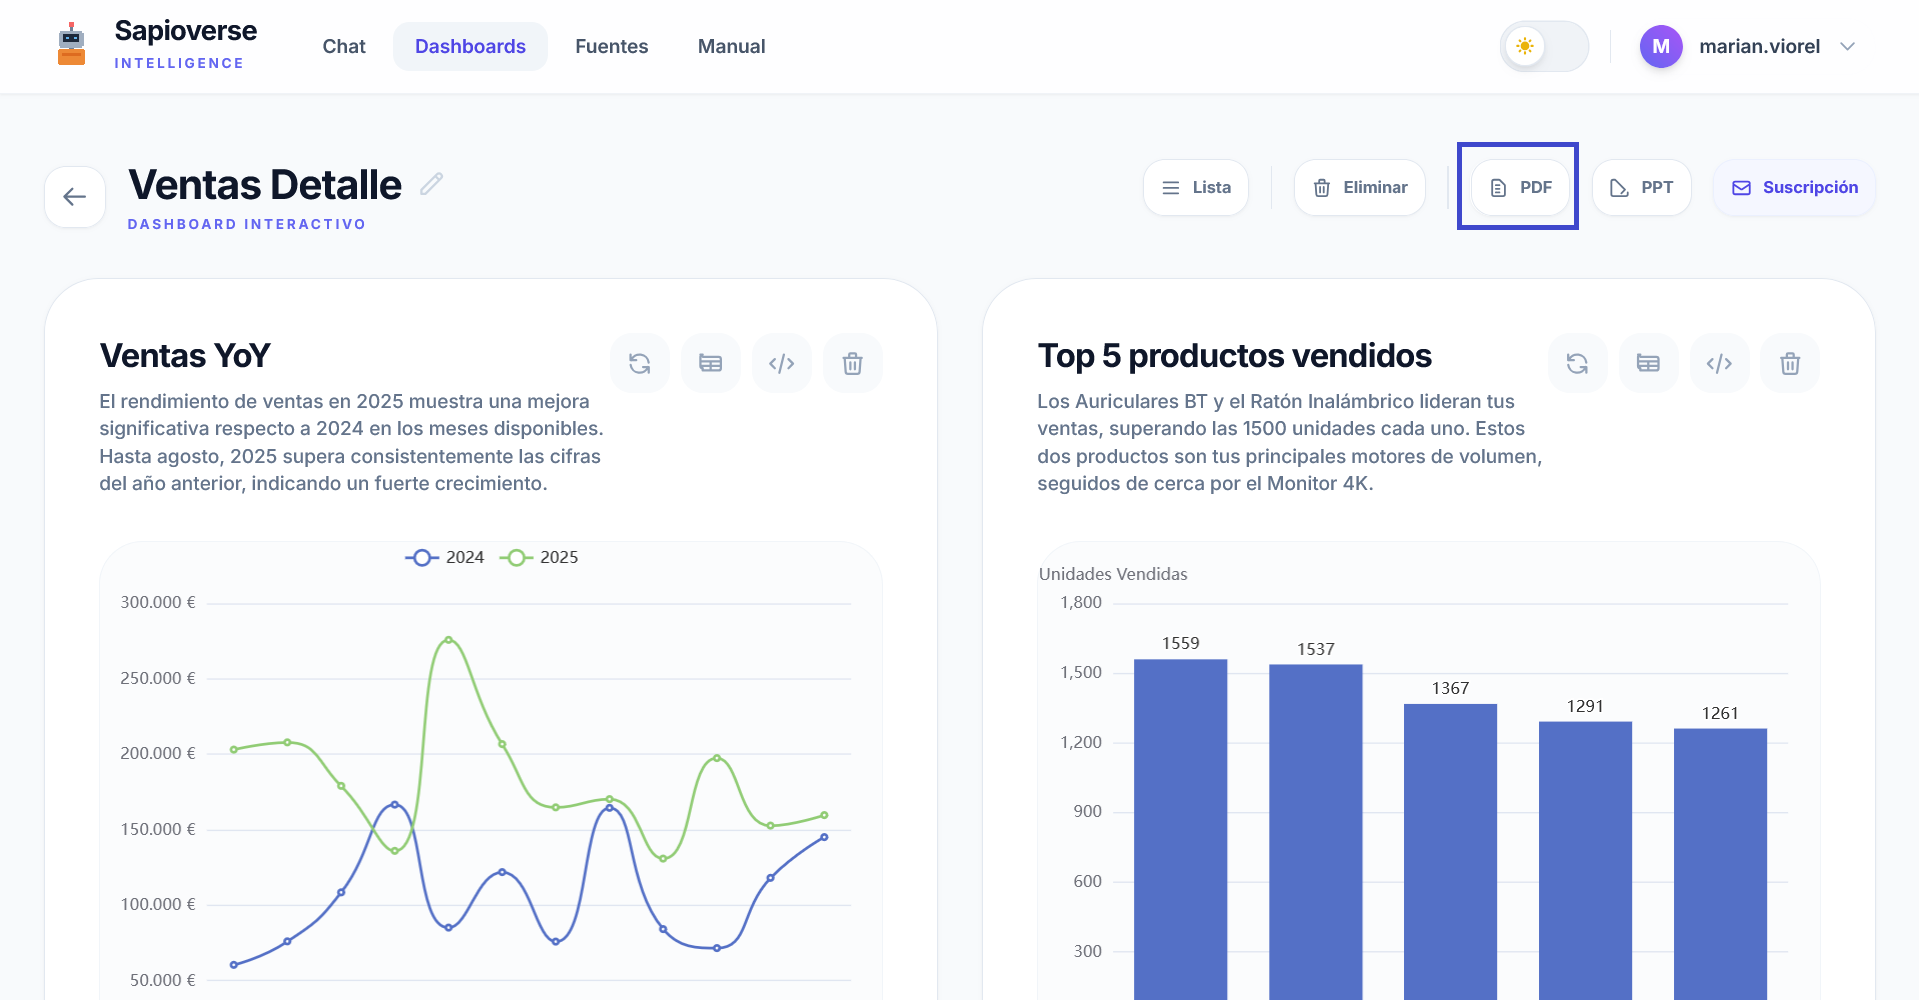
Detailed Exploration
Interact with your data dynamically. Scroll down to discover the management and export tools.
Chart Management


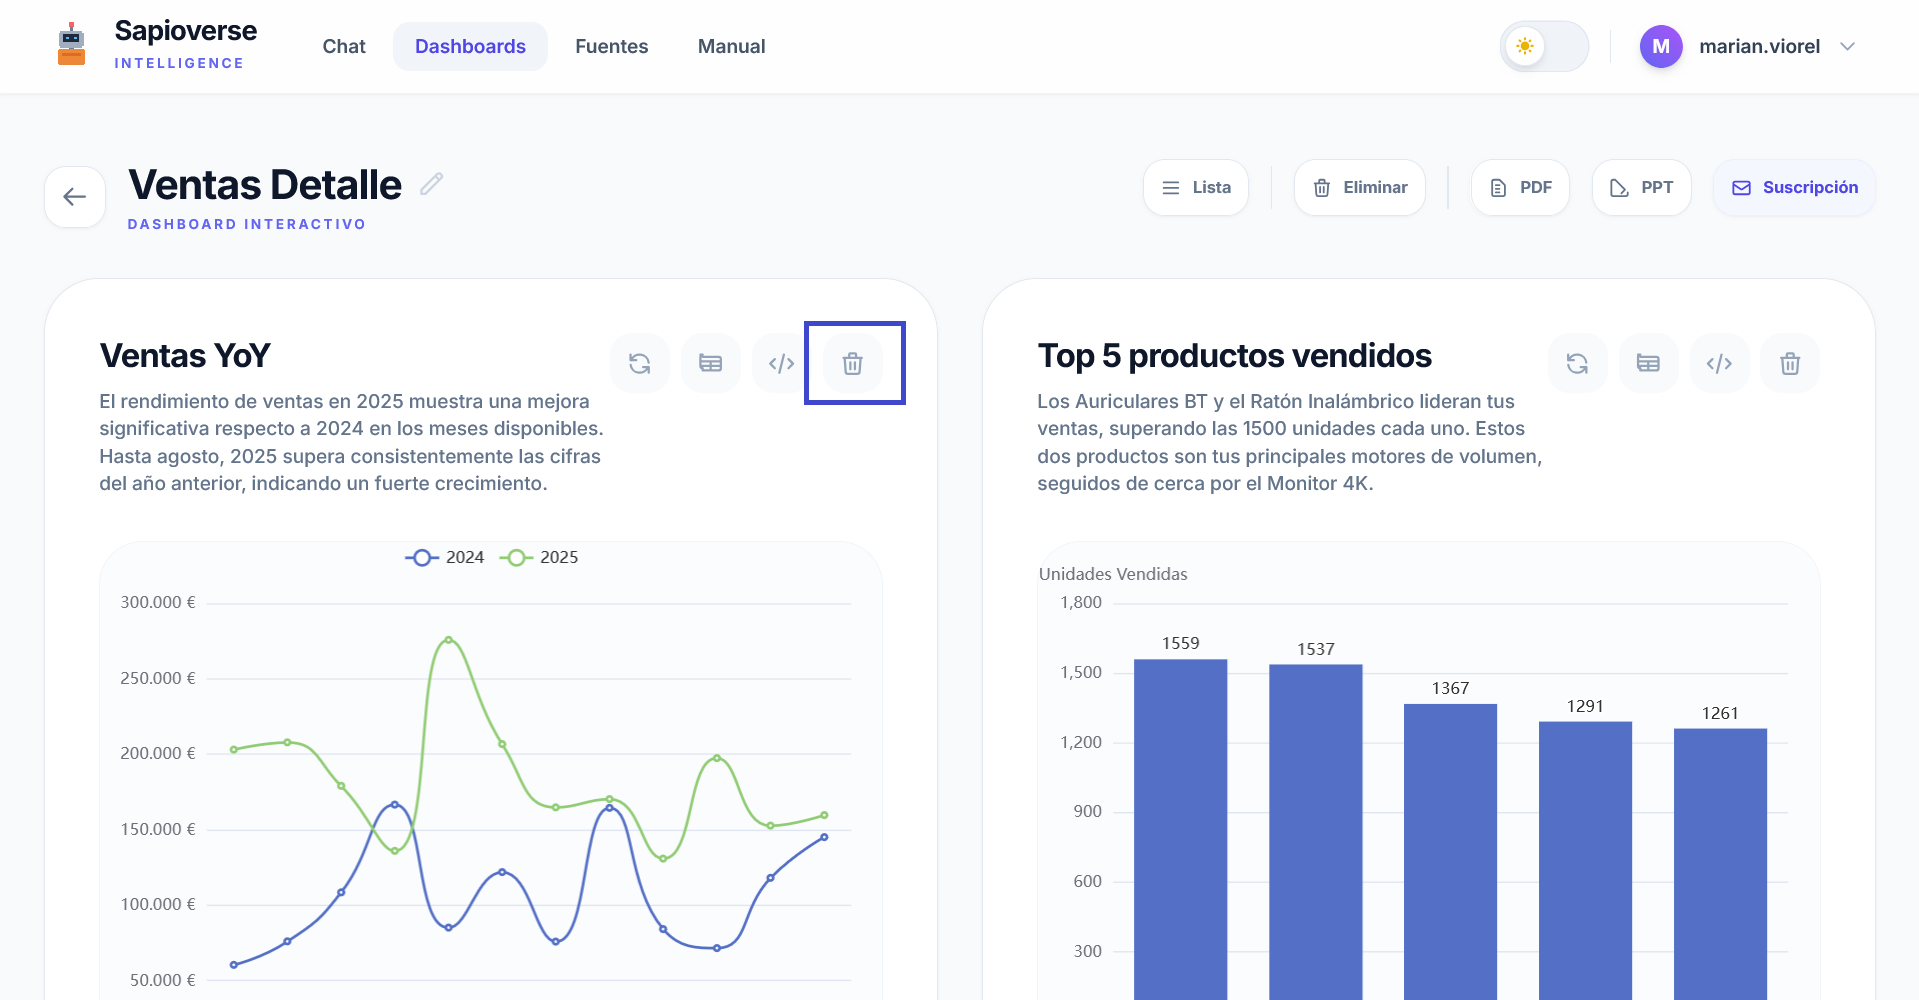
Editable Titles
Adapt each chart to your business context by changing its title directly from the dashboard interface.
Data Refresh
Charts update automatically upon entry. You can also force a manual update to see the latest changes.
View Data and SQL
Inspect the original data table or the SQL code that generated the chart for maximum transparency.
Delete Charts
Keep your panels clean by removing visualizations that are no longer necessary with a single click.
PDF and PPT Export
Download the full dashboard for your presentations or official reports in PDF or PowerPoint.
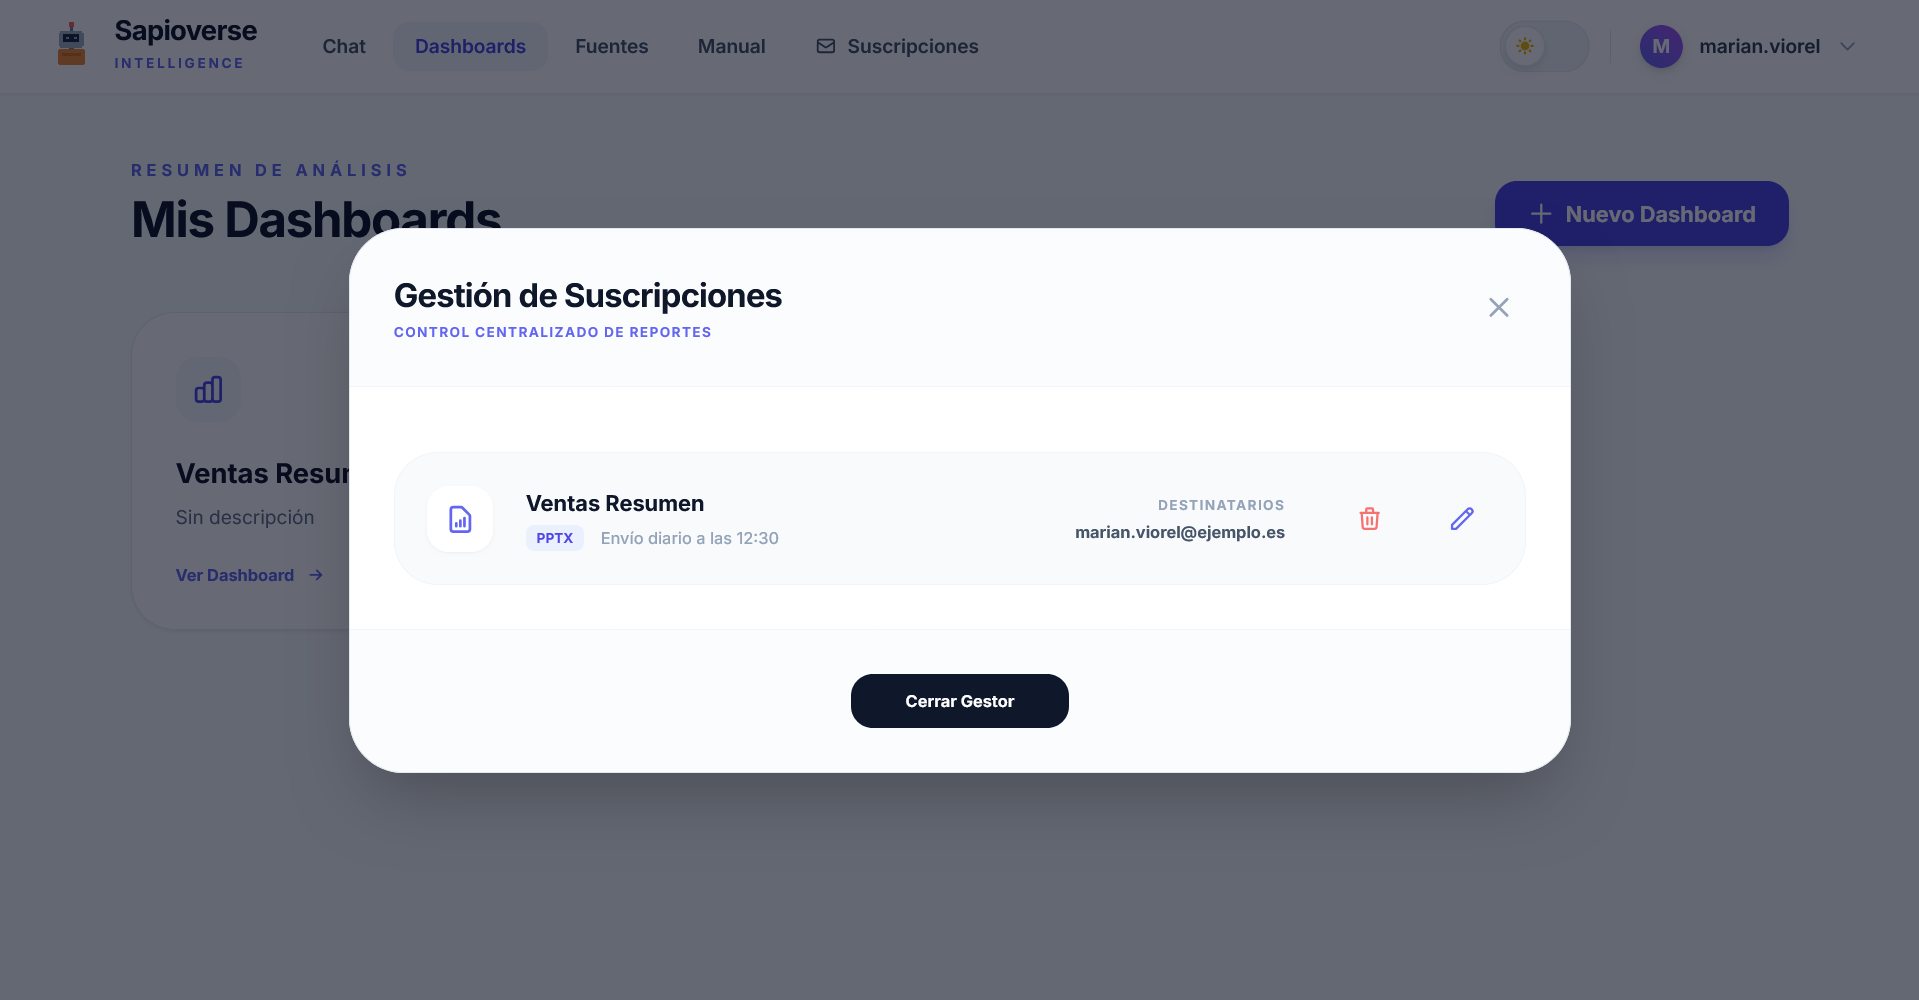
Email Subscriptions
Automate the sending of your panels to relevant stakeholders on a recurring basis.
Flexible Scheduling
Choose specific days and times for automatic delivery. Sapioverse guarantees punctuality.
Panel Management
Go back to the general list or delete full panels to organize your workspace efficiently.
Global Tools


Data Source Management
Define and explain to the system what information it should use to answer your questions. Connect your databases and give them the necessary business context.
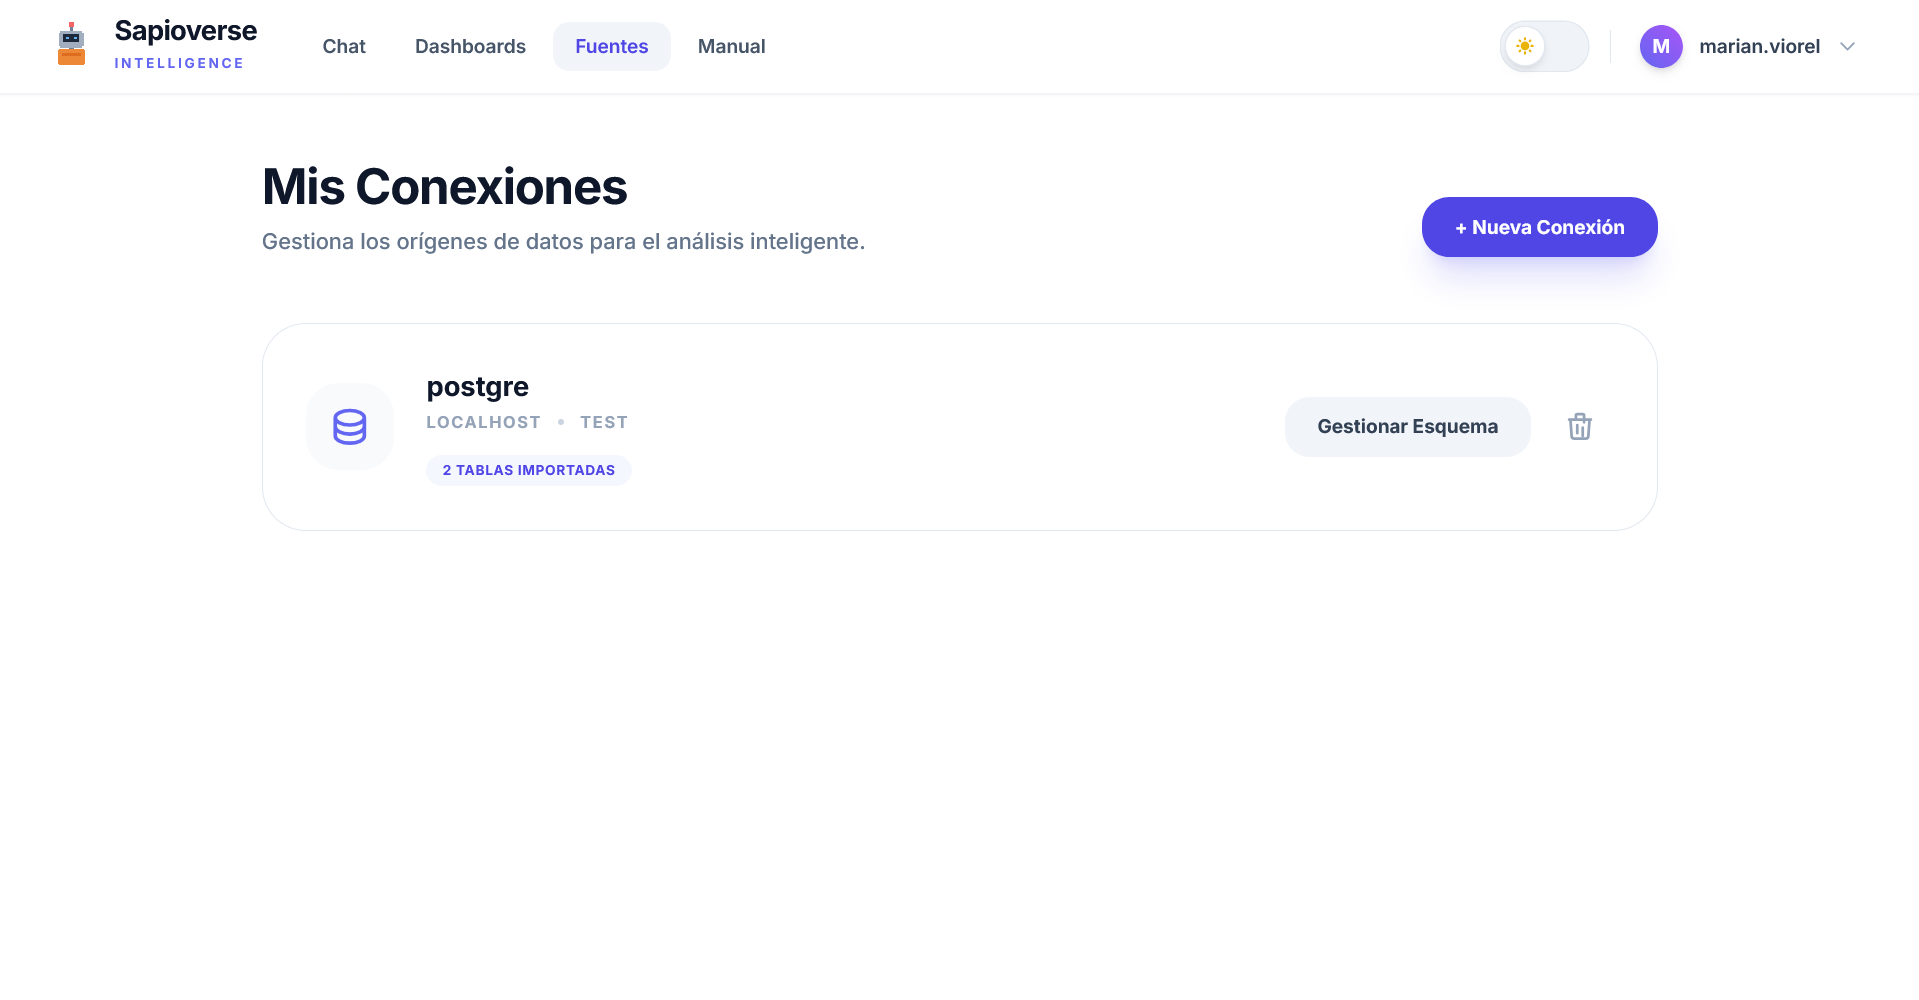
New Connections
Add your SQL databases in seconds by configuring access parameters. Supported engines: SQL Server, PostgreSQL, Oracle, SAP HANA, MySQL, MariaDB and SQLite.
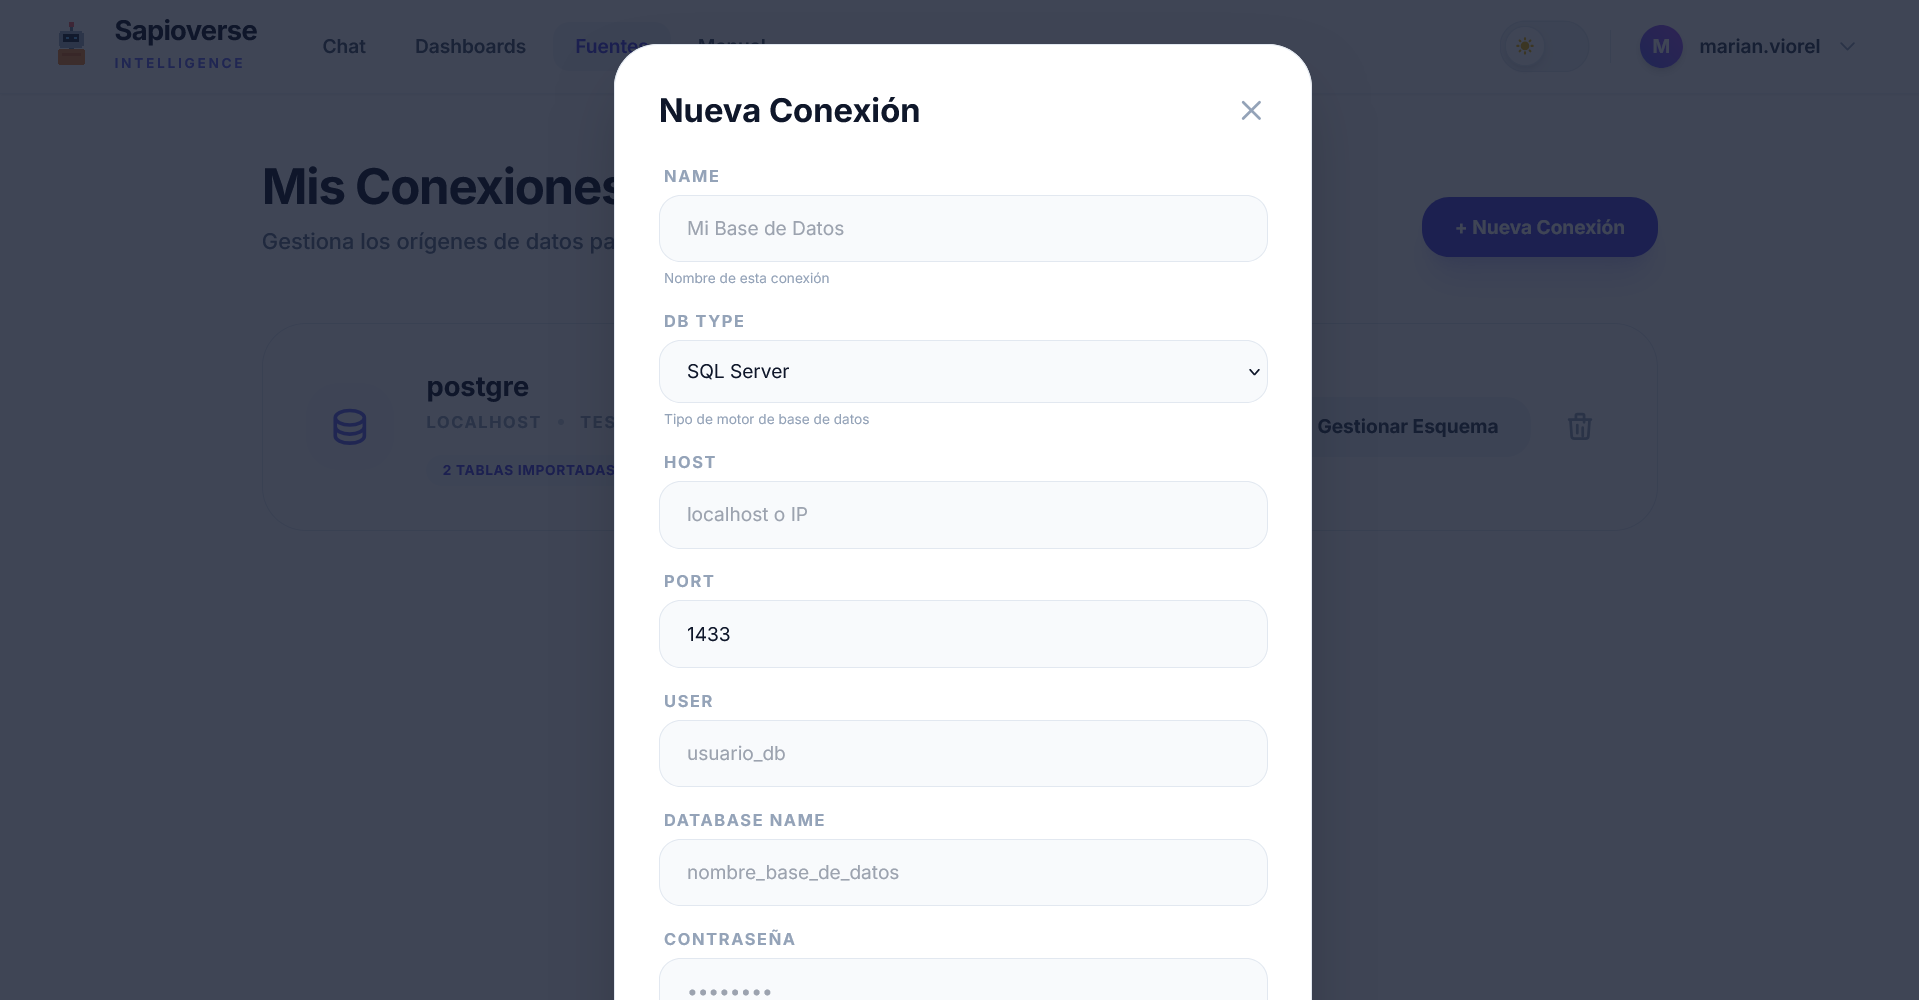
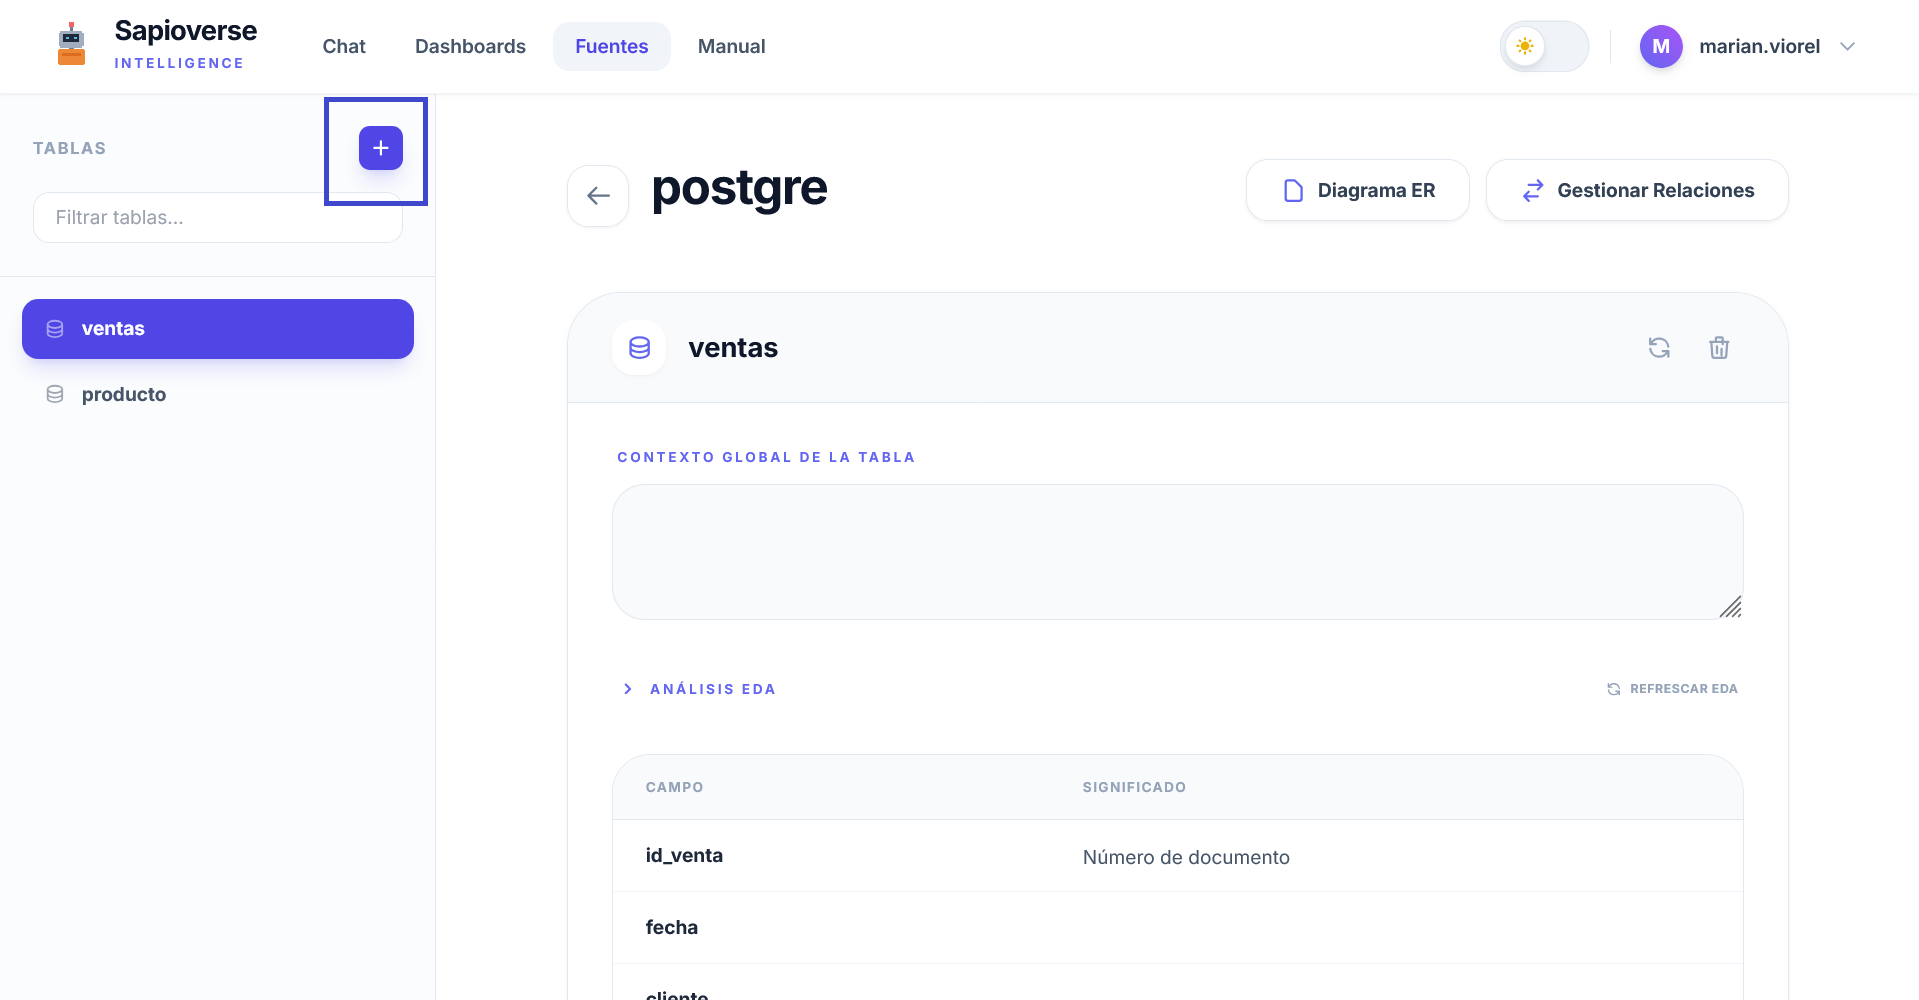
Table Selection
You don't need to import your entire database. Select only the tables that contain relevant information for your analyses.
Direct connection or Gateway
When creating a connection you choose how Sapioverse reaches your database. If it is already reachable from outside (a managed cloud database), use the direct connection. If it lives inside your network, use a Gateway: you install a local Agent and nothing needs to be opened in your firewall.
Direct connection
Nothing to install. Your database server must allow our address 5.250.186.62 through its firewall, and the user must be read-only.
Gateway (local Agent)
No ports opened and no fixed IP needed: the Agent always starts the connection outwards. Database credentials stay on your machine.
Setting up the Agent, step by step
- 1In Connections → Gateway, click Generate New Token. The token identifies that Agent and belongs to your organization.
- 2Download the Agent from that same page: Windows, macOS, Linux, or the Python script if your policy is not to run third-party binaries.
- 3Install it on a machine in your network that already reaches the database. Paste the token and add the database: engine, host, port and a read-only user.
- 4Back in Sapioverse, create the connection choosing Gateway as routing and pick the database the Agent reports. Then sync the schema as usual.
Two things worth knowing first
- SQLite can only be connected through a Gateway, never directly.
- SQL Server through the Agent needs Microsoft's ODBC driver (msodbcsql18) installed on the machine running the Agent. The other engines need nothing extra.
Need to explain this to your IT team before starting? There is a public guide with the architecture and the security rationale: How to connect your database.
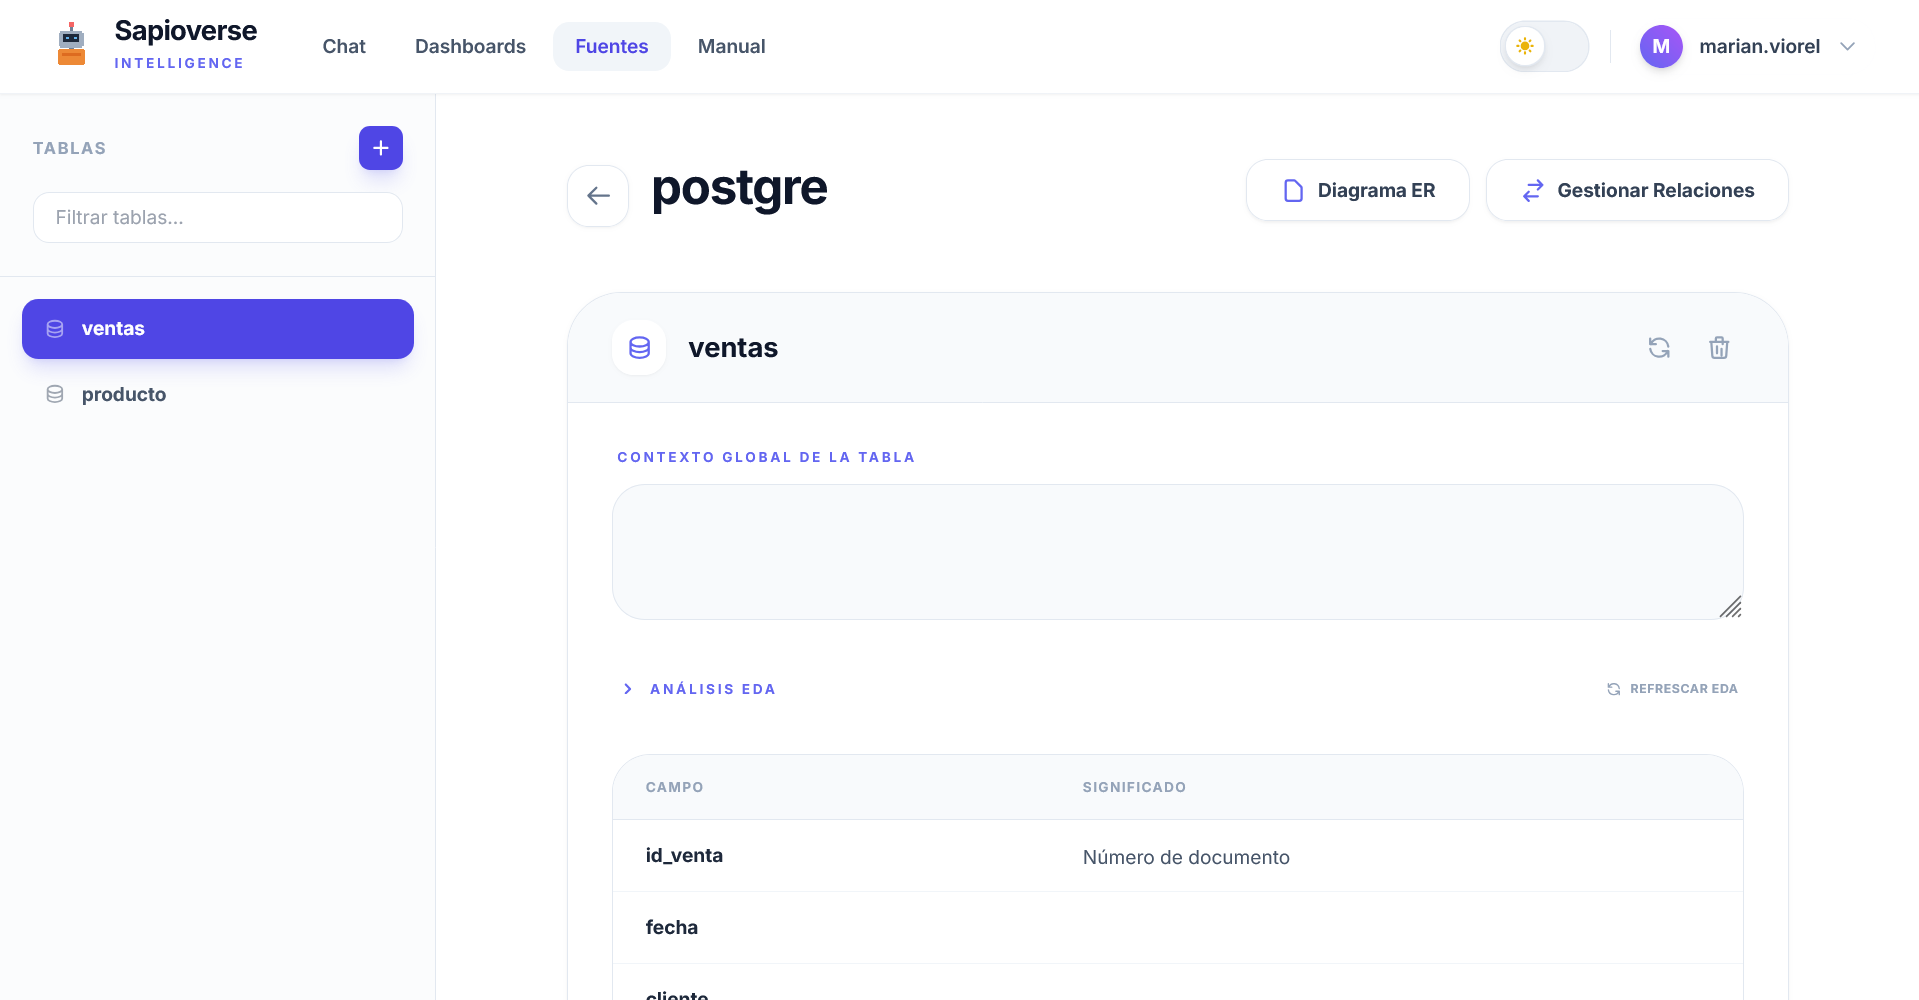
Business Context
It is essential to explain what your data means so the IA can provide accurate answers.
Data Tools
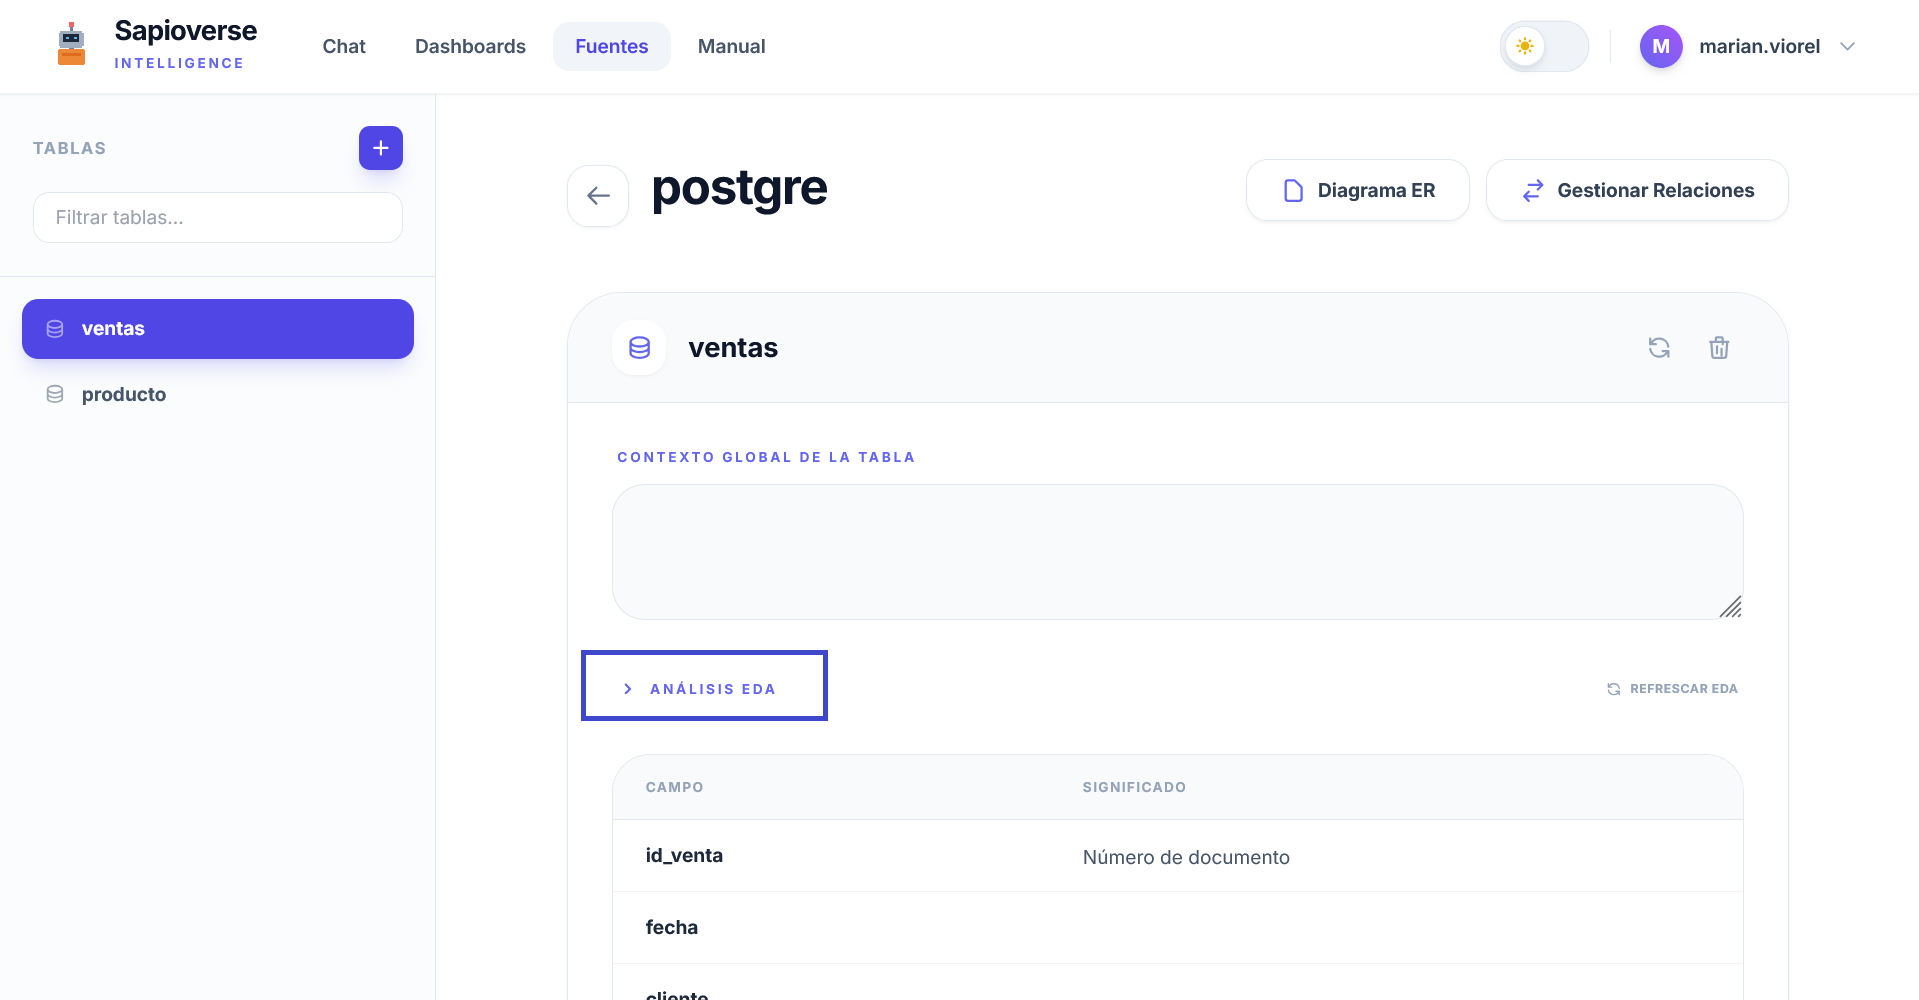

EDA Statistics
Generate an automatic statistical report to understand the distribution and quality of your data instantly.
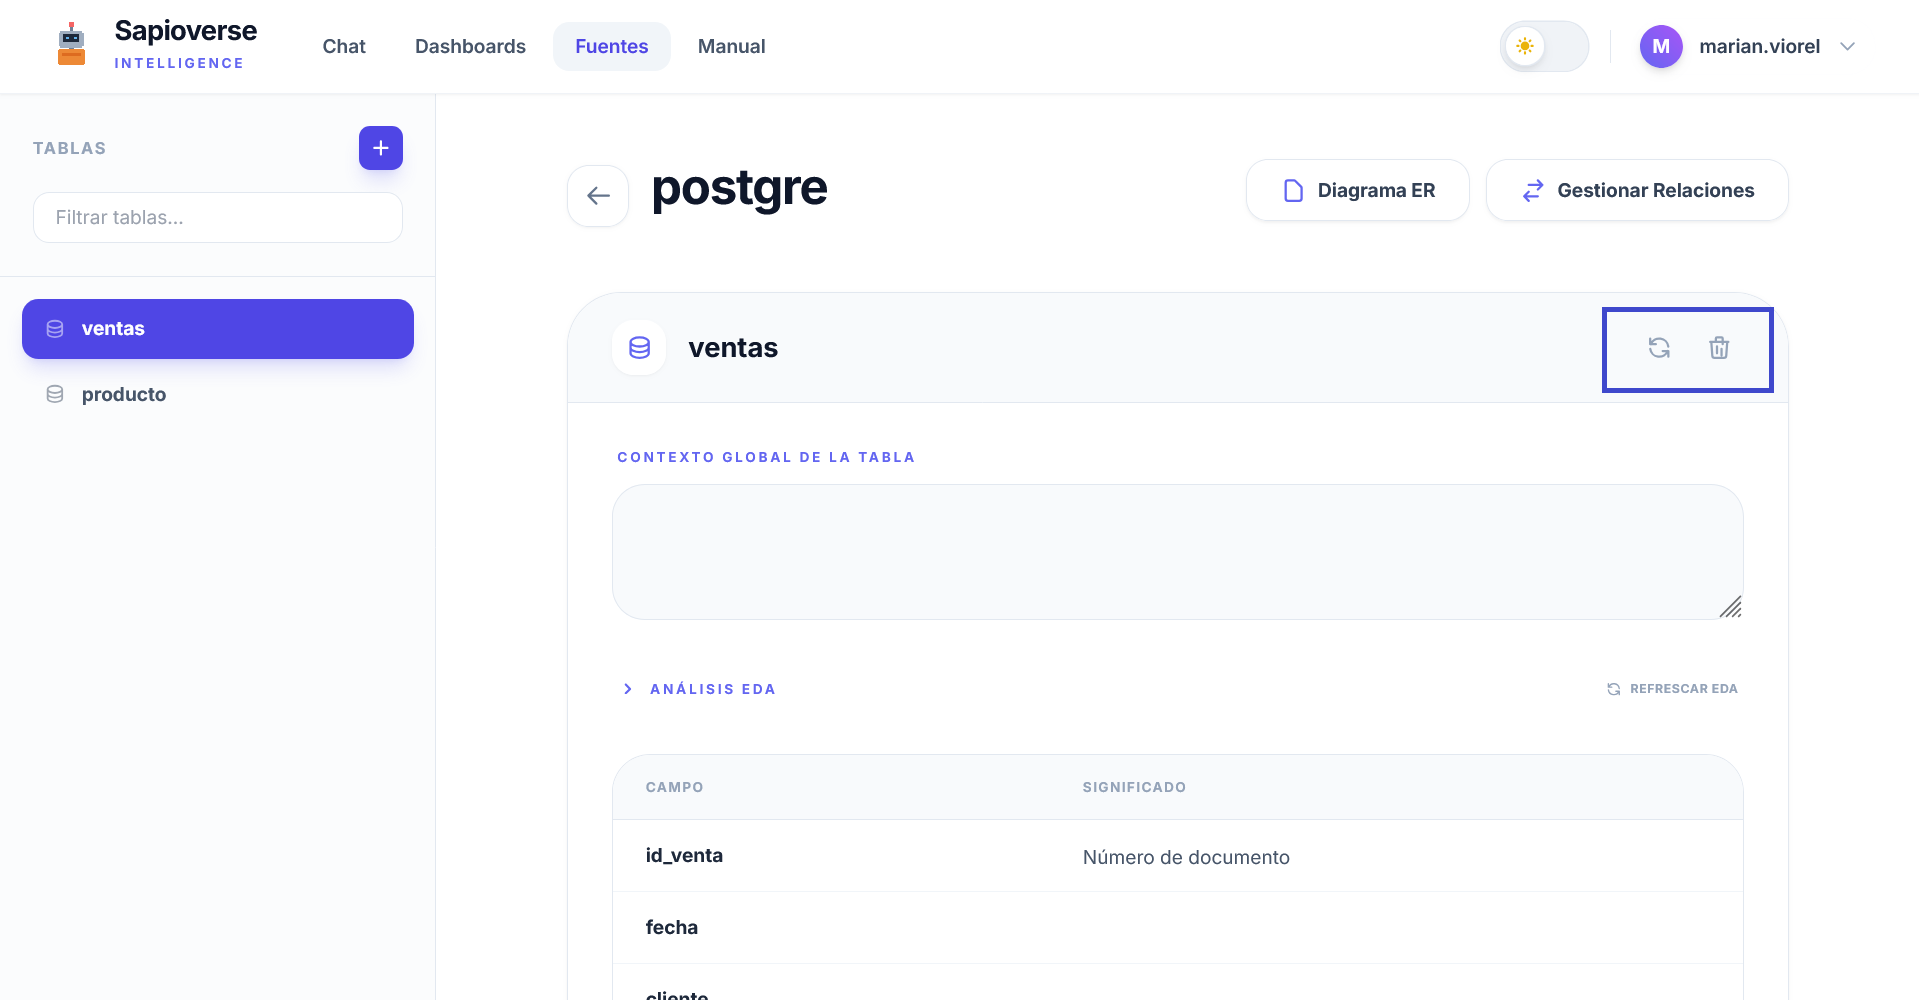
Refresh Metadata
If your data changes or new records are added, use this option so the IA updates its statistical view.
Structure and Deletion
Refresh the table structure to detect new columns or remove the table from the system if you no longer need it.
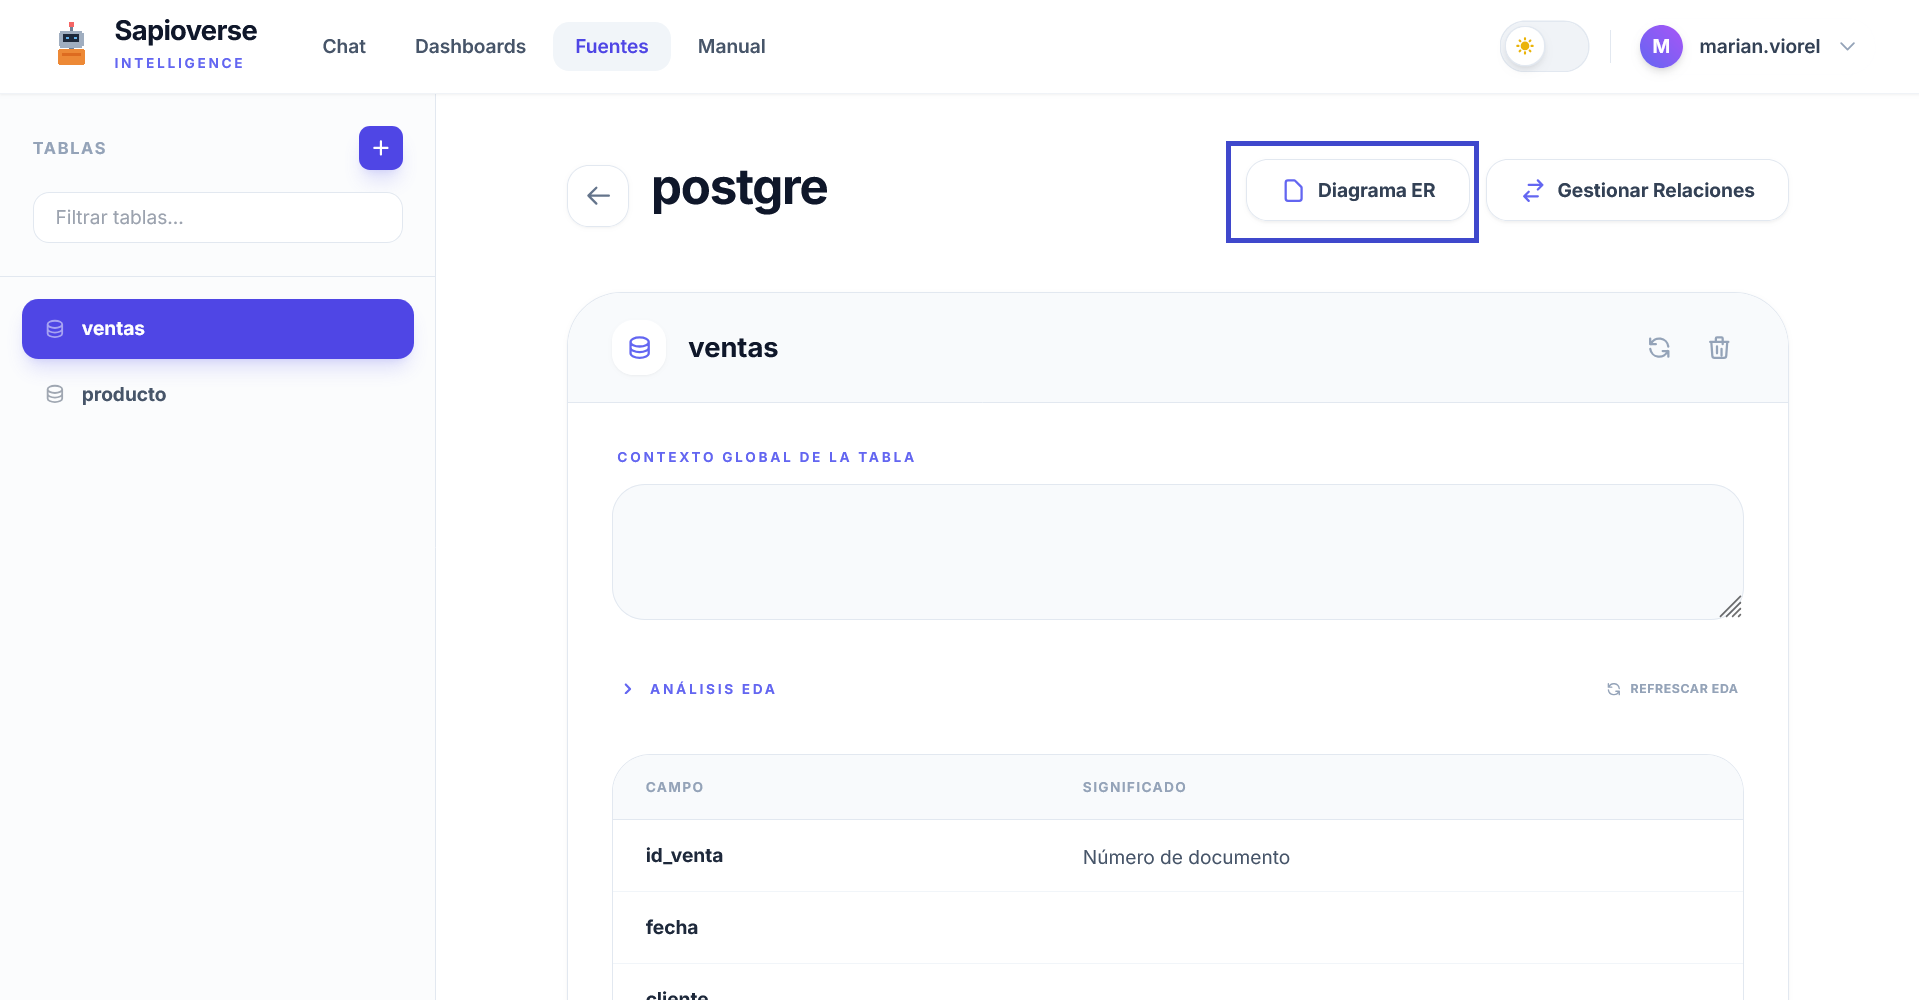
Visual Data Map
Visualize the architecture of your information through an interactive Entity-Relationship diagram.
ER Diagrams
Access a graphical representation of your tables and their connections by clicking the ER Diagram button on any connection.
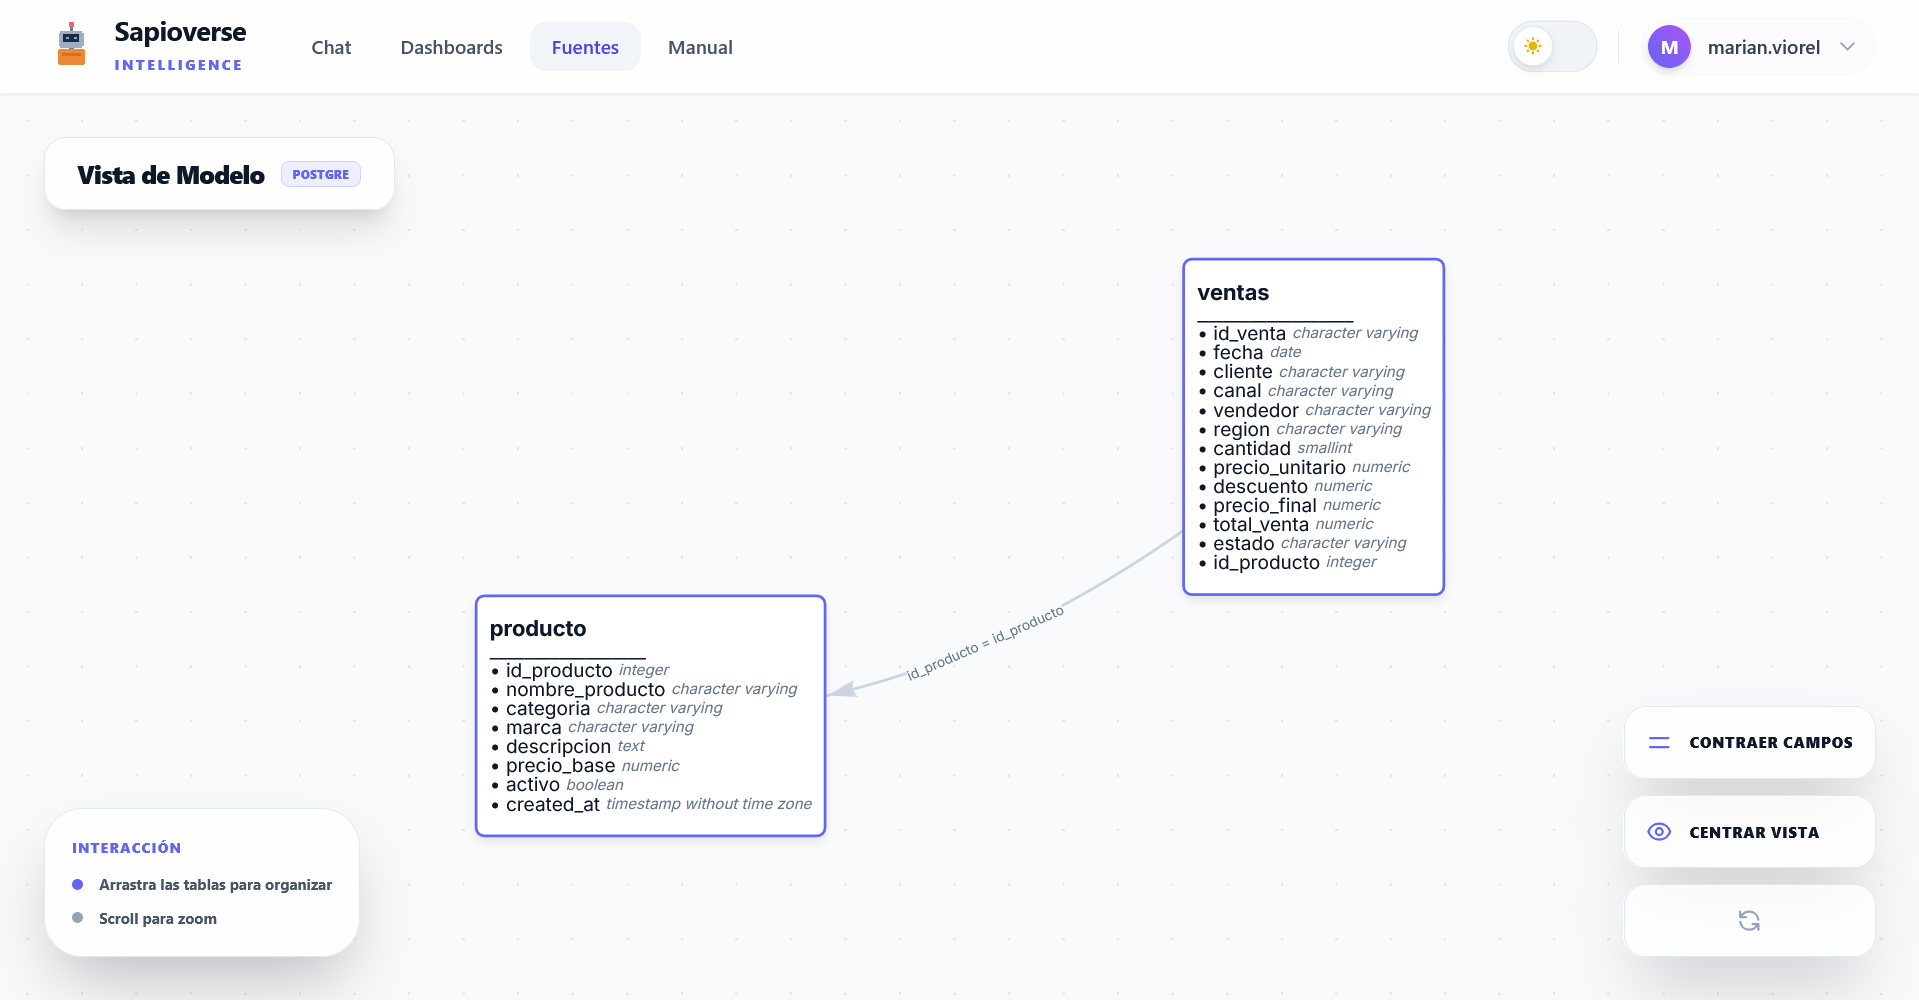
Organize tables by dragging them and use zoom to navigate.
Use 'View Fields' to inspect the columns of each table.
'Reset' button to automatically center the view.
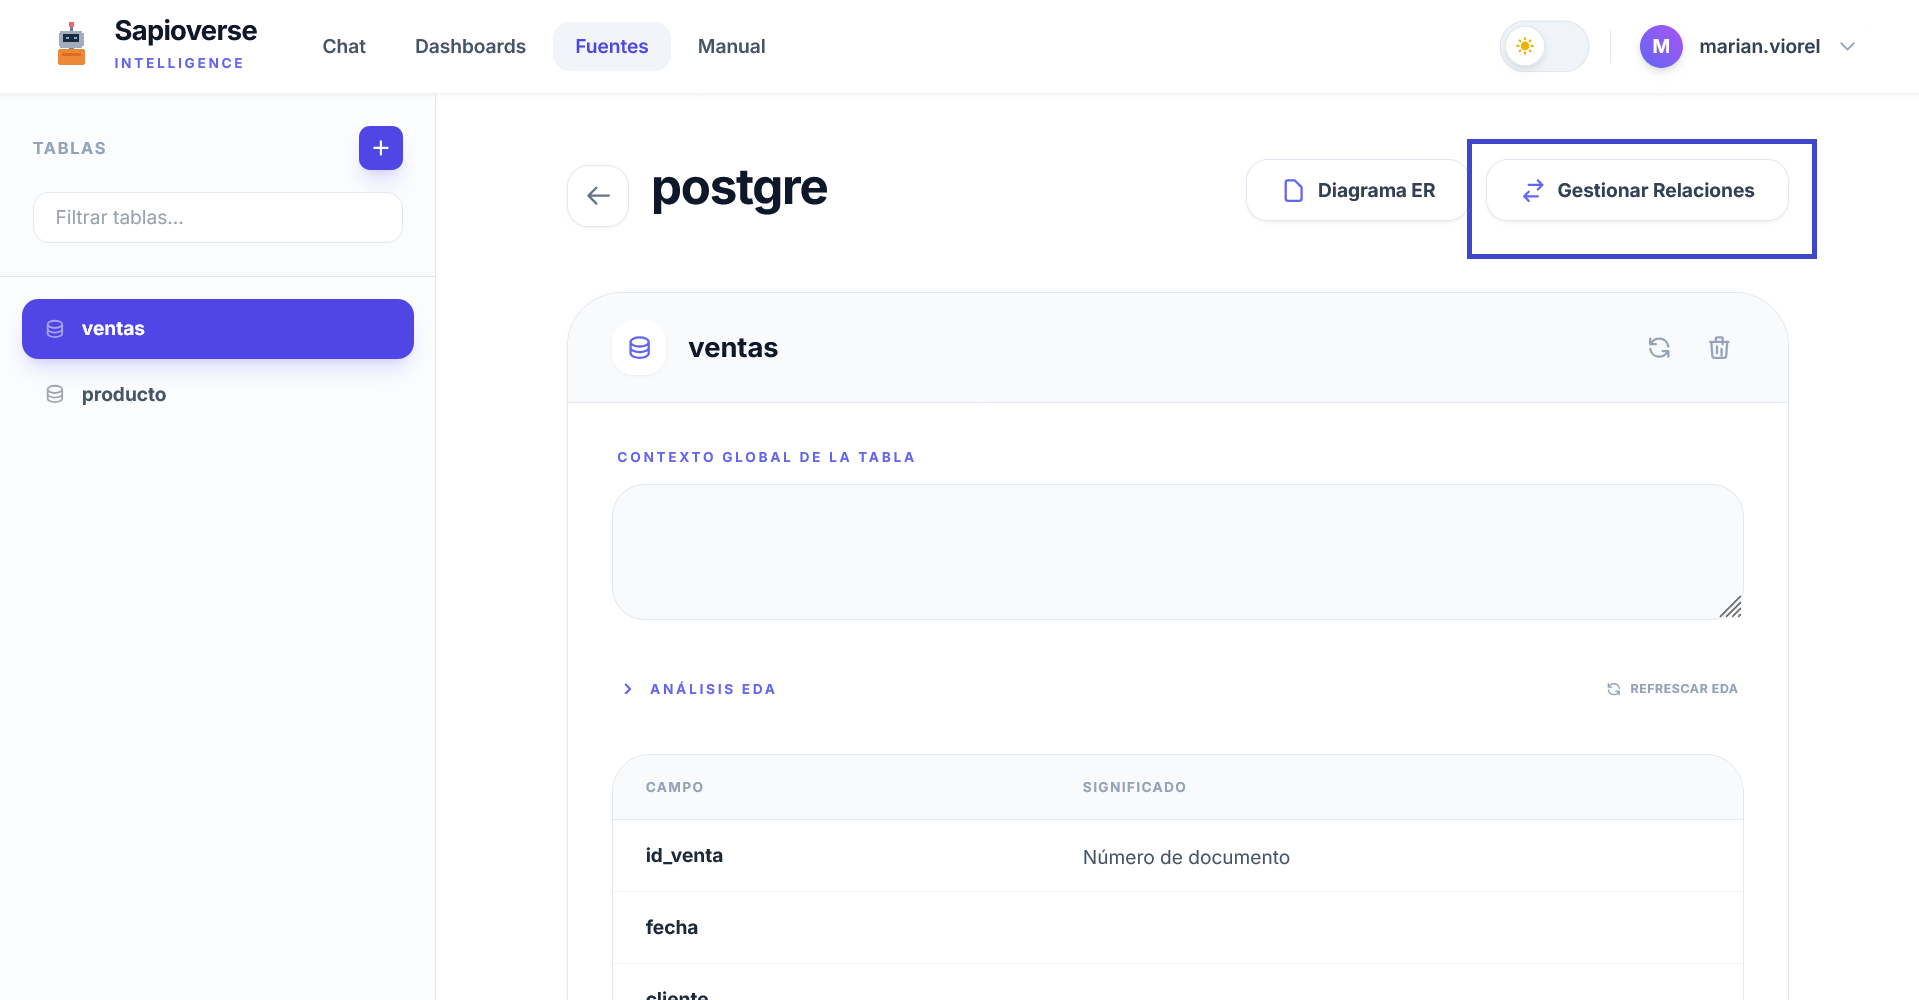
Table Relationships
To perform advanced analyses that cross-reference information (e.g., Sales by Salesperson), you must define how tables connect.
Manage Relationships
Define 'Many-to-One' relationships so the Chat understands how data from different departments relate.
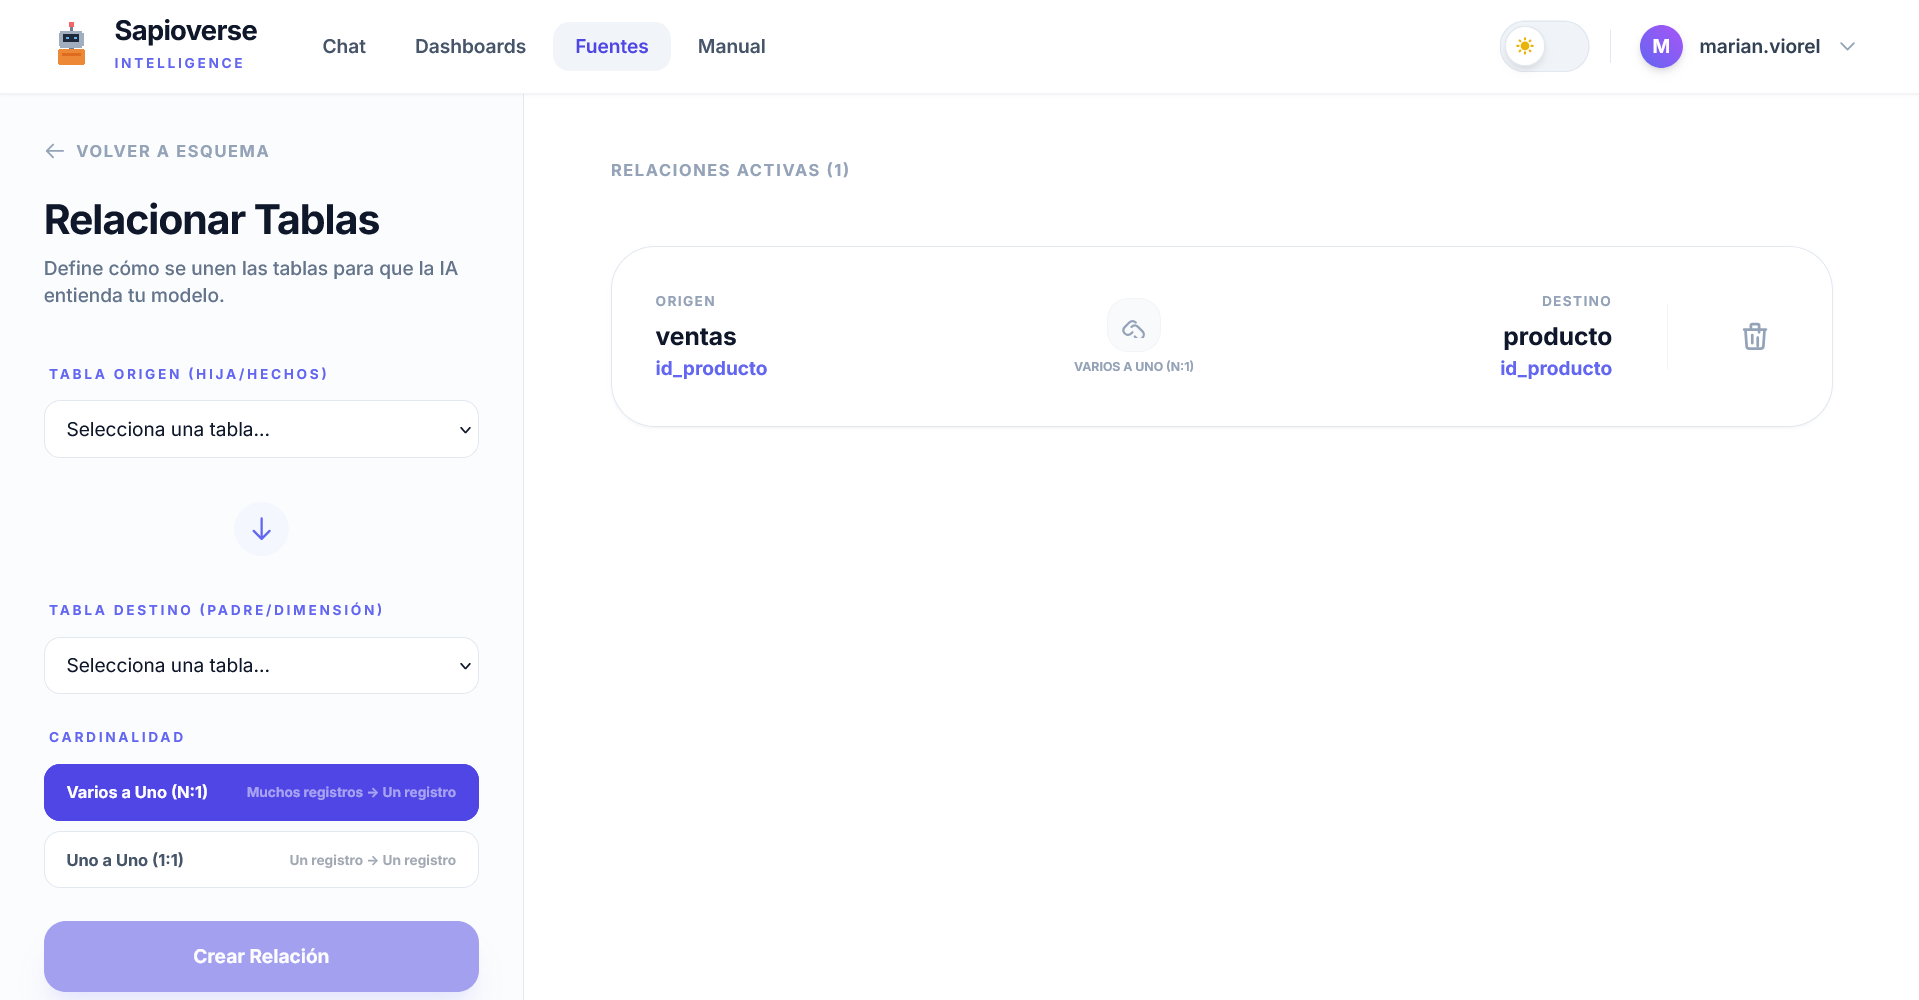
Components of a Relationship
-
1
Fact Table (Sales)
The main table containing the numerical values you want to analyze.
-
2
Dimension Table (Customers)
The table that provides categories or names to filter data (e.g., the customer's name).
-
3
Join Fields (FK / PK)
The unique identifier shared by both tables (e.g., CUSTOMER_ID).
Let's get started!
Set up your data sources and discover the hidden value in your information with Sapioverse.
Get started now