Your AI data analyst
Get business answers
by talking to your data.
Analyze, summarize and visualize in seconds, without asking anyone for a report.
If you can ask, you already know how to use it.
Ask anything about your business.
It's not a generic chatbot. It knows your business.
Step 01 of 06
Connect your data
A secure connection in minutes. Read-only, and you decide what it can see.
Pick your business
Connected · read-onlySchema and relationships imported automatically · sample data
Step 02 of 06
By your rules
You write your rules once and it answers with your criteria, not textbook definitions.
productos
Global table context
Step 03 of 06
In your language
Ask the way you would talk to your team. And if you don't know where to start, it suggests questions.
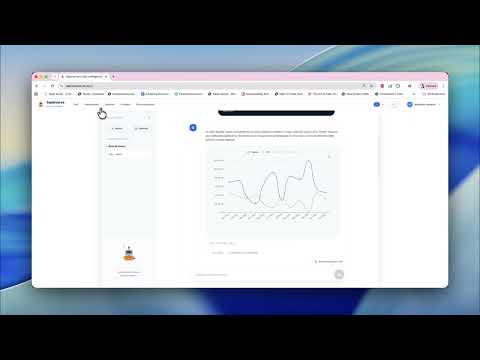
Smart analysis
Explore your data in natural language. What do you want to discover today?Explore your data in plain language. What do you want to discover today?
Suggestions generated from your data · sample data
Step 04 of 06
Build your dashboard
The questions you repeat become a live panel, shared with your team.
My dashboard
Monthly trend
Sales by channel
Accumulated revenue (YTD)
412.500 €
↑ +18% vs last yearTop customers
Updates on its own with your data · sample data
Step 05 of 06
Build your reports in minutes
Take the panel into a presentation that is ready for the meeting, or download the full data to Excel and pivot it your way.
Presentation
PPTXSales by product · July
3L Detergent leads with 30,873 €, up +18% versus last year.
Every chart, a slide with its reading
Spreadsheet
XLSXThe full data, not a screenshot
From the answer to the meeting, with nothing to touch up · sample data
Step 06 of 06
Control stays with your team
A SQL Workspace for your technical team: schema in view, read-only and export. Every figure, auditable down to the exact query.
SQL Workspace
Schema
productos
producto_id int
nombre varchar
precio_tarifa numeric
clientes
pedidos
lineas_pedido
Read-only by design: validation blocks any write · sample data
See it working, in one minute.
Data services
The tool is one part. The other is getting your data ready.
Beyond the product, we build our clients' data processes: we bring together what is scattered across the ERP, spreadsheets and the PIM, we agree on what things are called and we automate what is done by hand today. Projects with names attached, done by people.
Data services: the work of getting your data in shape, on the systems you already have.
The product: where the business asks and decides. It lives alongside your reports, it doesn't replace them.